
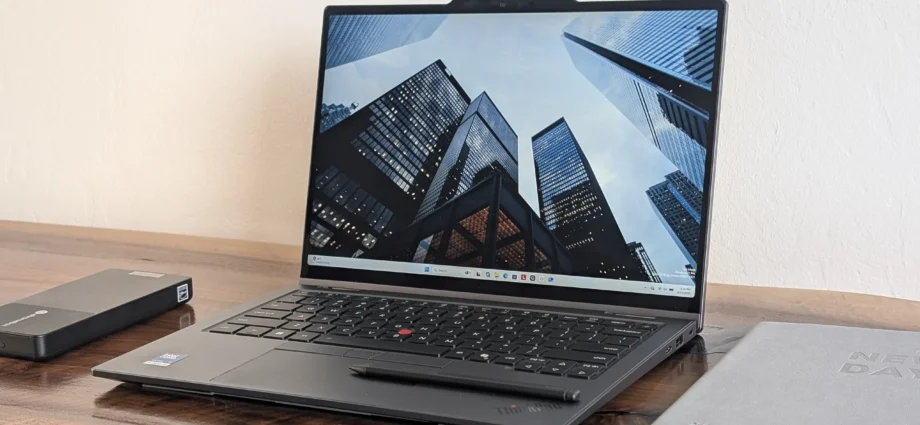
Panther Lake for more consistent performance.
The 14-inch ThinkPad X1 is back this year, powered by Panther Lake and with a refreshed look. The list of minor changes adds up to a noticeably better user experience, especially depending on the configuration.
Verdict — New Professional Look
Whereas last year’s ThinkPad X1 2-in-1 Gen 10 can look too much like an IdeaPad or Yoga, the refreshed ThinkPad X1 2-in-1 Gen 11 incorporates more visual ThinkPad elements for a more professional feel. The changes to the Power button, clickpad, pen charging, and overall size and weight make the ThinkPad X1 2-in-1 Gen 11 easier to use in its many modes.
The new pen charging recess, however, is a mixed bag. While it’s an aesthetically pleasing and more secure solution than on last year’s model, the new stylus must be thinner compensate. The small Slim Pen 2 can therefore be more uncomfortable to grip than the thicker Yoga Pen that would ship with the ThinkPad X1 2-in-1 Gen 10. In other words, while we prefer the Gen 11 chassis design over the Gen 10, the opposite is true when it comes to their pens.Download your licensed rating image as SVG / PNG
Test device courtesy of Lenovo
Download your licensed rating image as PNG / SVG
Performance-wise, don’t expect this year’s model to perform much faster than last year’s model unless if configured with the top-end Core Ultra X7 option with the much more impressive Arc B390 GPU.
Pros
+slightly thinner and lighter than before
+up to Core Ultra X7 Panther Lake
+great speakers for the size
+actual clickpad buttons
+optional WWAN
Cons
–relatively weak GPU unless if configured with Arc B390
–no end-user upgrades beyond single M.2 2280 SSD
–Slim Pen 2 stylus could be thicker for a better grip
–no new display options over 2025 model
–no three-year base warranty
The ThinkPad X1 2-in-1 Gen 11 directly succeeds last year’s ThinkPad X1 2-in-1 Gen 10. While the previous two models were visually identical, this year’s Gen 11 is a full redesign complete with both new Intel Panther Lake CPU options and a refreshed look.
Our test unit is a middle configuration with the Core Ultra 7 355 and 1200p60 IPS touchscreen for approximately $2700. Lesser SKUs ship with the Core Ultra 5 325 while the top-end option ships with the significantly faster Core Ultra X7 368H and 1800p120 OLED touchscreen.
Competitors in this space include other business-centric convertibles like the Dell Latitude 7450 2-in-1, HP EliteBook X Flip G1i 14, or the MSI Prestige 14 Flip series.
Specifications
Lenovo ThinkPad X1 2-in-1 Gen 11 (ThinkPad X1 2in1 Series)
Processor
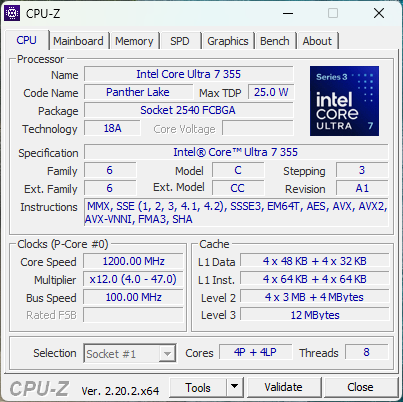
Intel Core Ultra 7 355 8c/8t, 4 x 4.7 GHz Intel Cougar Cove P-Core, 4 x 3.5 GHz Intel Darkmont LP E-Core, 55 W PL2 / Short Burst, 46 W PL1 / Sustained, Panther Lake
Graphics adapter
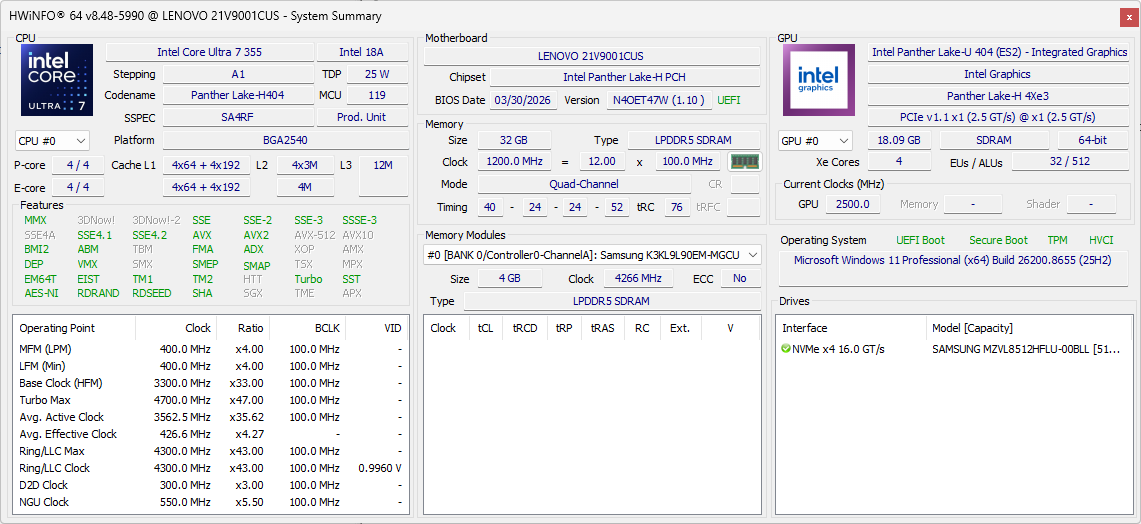
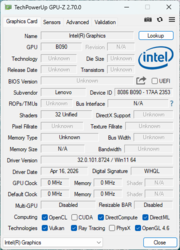
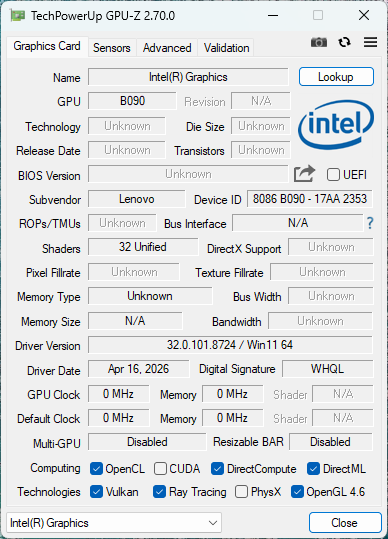
Intel Graphics 4 Xe3 Panther Lake iGPU, Core: 2500 MHz, LPDDR5X, 32.0.101.8724
Memory
32 GB
, LPDDR5X-9600, Soldered
Display
14.00 inch 16:10, 1920 x 1200 pixel 162 PPI, 10-point capacitive, native pen support, AUO B140UAN10.0, IPS, glossy: yes, 60 Hz
Mainboard
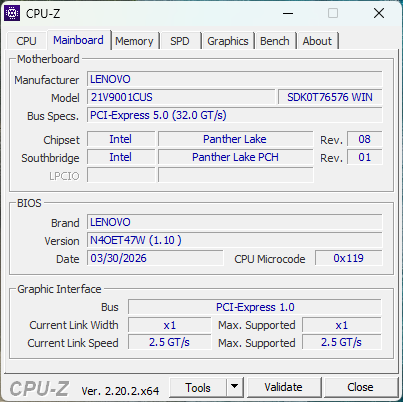
Intel Panther Lake-H PCH
Storage
Samsung PM9C1b MZVL8512HFLU-00BLL, 512 GB
Weight
1.317 kg ( = 46.46 oz / 2.9 pounds), Power Supply: 225 g ( = 7.94 oz / 0.5 pounds)
Note: The manufacturer may use components from different suppliers including display panels, drives or memory sticks with similar specifications.
Case
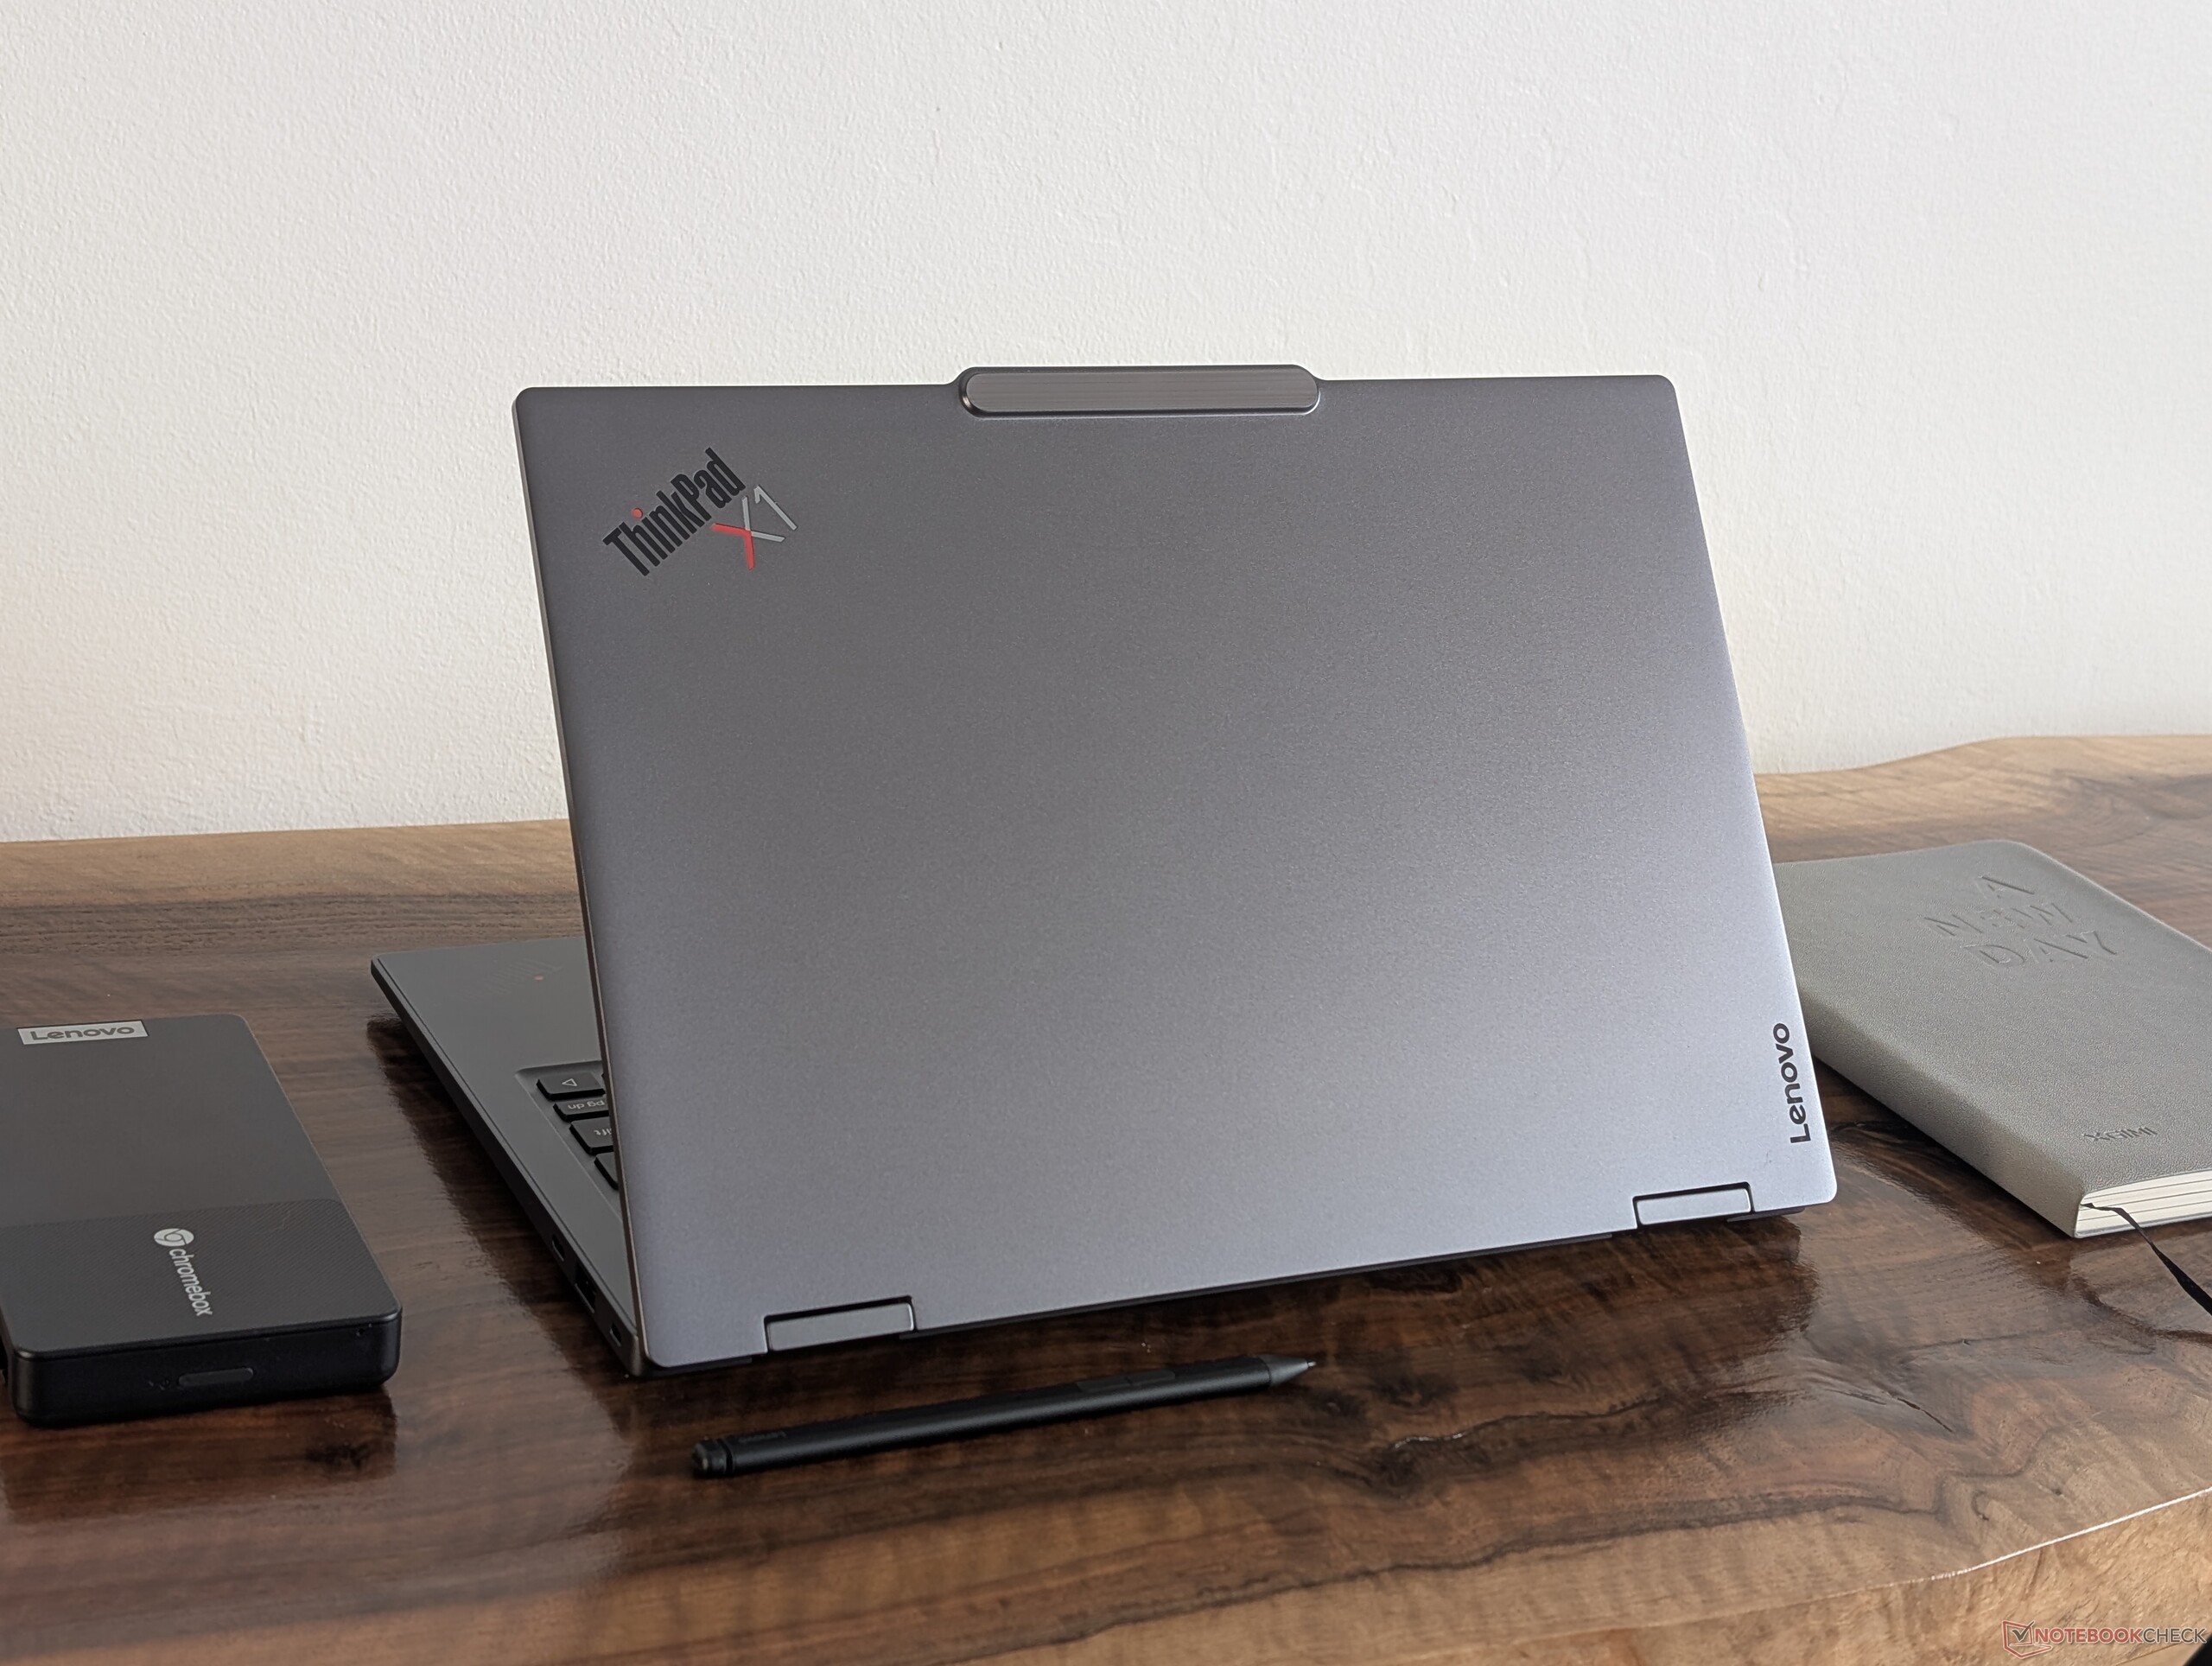
The new chassis is ever-so-slightly thinner and lighter than before by about 100 grams and a fraction of a millimeter, respectively, without feeling any weaker or less expensive. In fact, many of the superficial changes from the logos to the overall darker color tones are more aesthetically professional whereas the older ThinkPad X1 2-in-1 Gen 10 would appear more consumer-oriented or IdeaPad-like.
The most notable addition to the redesign is the recess on the bottom panel near the front edge for stowing and charging the Slim Pen 2 stylus. The recess secures the pen more strongly than the typical magnets along the outer edges of most other convertibles including last year’s model.
Size Comparison
Lenovo ThinkPad X1 2-in-1 Gen 11 Lenovo ThinkPad X1 2-in-1 Gen 10 Lenovo Yoga Book 9 14IAH10 Dell Latitude 7450 2-in-1 HP EliteBook X Flip G1i 14 AI Asus ExpertBook Ultra B9406CAA DIN A4 ❌313.5 mm / 12.3 in219.25 mm / 8.63 in17.9 mm / 0.705 in1.3 kg2.9 lbs312.8 mm / 12.3 in217.7 mm / 8.57 in18.3 mm / 0.72 in1.4 kg3.03 lbs315.09 mm / 12.4 in209.5 mm / 8.25 in15.5 mm / 0.61 in1.2 kg2.68 lbs313 mm / 12.3 in222.8 mm / 8.77 in17.1 mm / 0.673 in1.5 kg3.31 lbs313.9 mm / 12.4 in219.9 mm / 8.66 in14.7 mm / 0.579 in1.5 kg3.31 lbs310.9 mm / 12.2 in212.8 mm / 8.38 in15.9 mm / 0.626 in1.1 kg2.45 lbs297 mm / 11.7 in210 mm / 8.27 in1 mm / 0.03937 in5.7 g0.01257 lbs
Connectivity
Port options are identical to last year’s model albeit with one fewer USB-A port. The relocated Power button also makes accidental presses less of an issue when handling in tablet mode.


Communication
| Networking | |
| iperf3 receive AXE11000 6GHz | |
| Dell Latitude 7450 2-in-1 Intel Wi-Fi 7 BE200 320MHz | 1743 (1699min – 1768max) MBit/s+10% |
| Asus ExpertBook Ultra B9406CAA Intel Wi-Fi 7 BE211 320MHz | 1621 (1600min – 1650max) MBit/s+2% |
| Lenovo ThinkPad X1 2-in-1 Gen 10 Intel BE201 320MHz | 1618 (1587min – 1635max) MBit/s+2% |
| Lenovo ThinkPad X1 2-in-1 Gen 11 Intel Wi-Fi 7 BE211 320MHz | 1587 (1151min – 1654max) MBit/s |
| HP EliteBook X Flip G1i 14 AI Intel BE201 320MHz | 1553 (782min – 1585max) MBit/s-2% |
| Lenovo Yoga Book 9 14IAH10 Intel BE201 320MHz | 1216 (1063min – 1322max) MBit/s-23% |
| iperf3 transmit AXE11000 6GHz | |
| HP EliteBook X Flip G1i 14 AI Intel BE201 320MHz | 1664 (1521min – 1752max) MBit/s+86% |
| Dell Latitude 7450 2-in-1 Intel Wi-Fi 7 BE200 320MHz | 1644 (1463min – 1690max) MBit/s+84% |
| Asus ExpertBook Ultra B9406CAA Intel Wi-Fi 7 BE211 320MHz | 1625 (848min – 1675max) MBit/s+82% |
| Lenovo ThinkPad X1 2-in-1 Gen 11 Intel Wi-Fi 7 BE211 320MHz | 1594 (1239min – 1759max) MBit/s+78% |
| Lenovo Yoga Book 9 14IAH10 Intel BE201 320MHz | 900 (834min – 966max) MBit/s+1% |
| Lenovo ThinkPad X1 2-in-1 Gen 10 Intel BE201 320MHz | 895 (797min – 962max) MBit/s0% |
010020030040050060070080090010001100120013001400150016001700
Lenovo ThinkPad X1 2-in-1 Gen 11; iperf3 receive AXE11000 6GHz; iperf 3.20: Ø1587 (1151-1654) MBit/s
Lenovo ThinkPad X1 2-in-1 Gen 11; iperf3 transmit AXE11000 6GHz; iperf 3.20: Ø1593 (1239-1759) MBit/s
Webcam
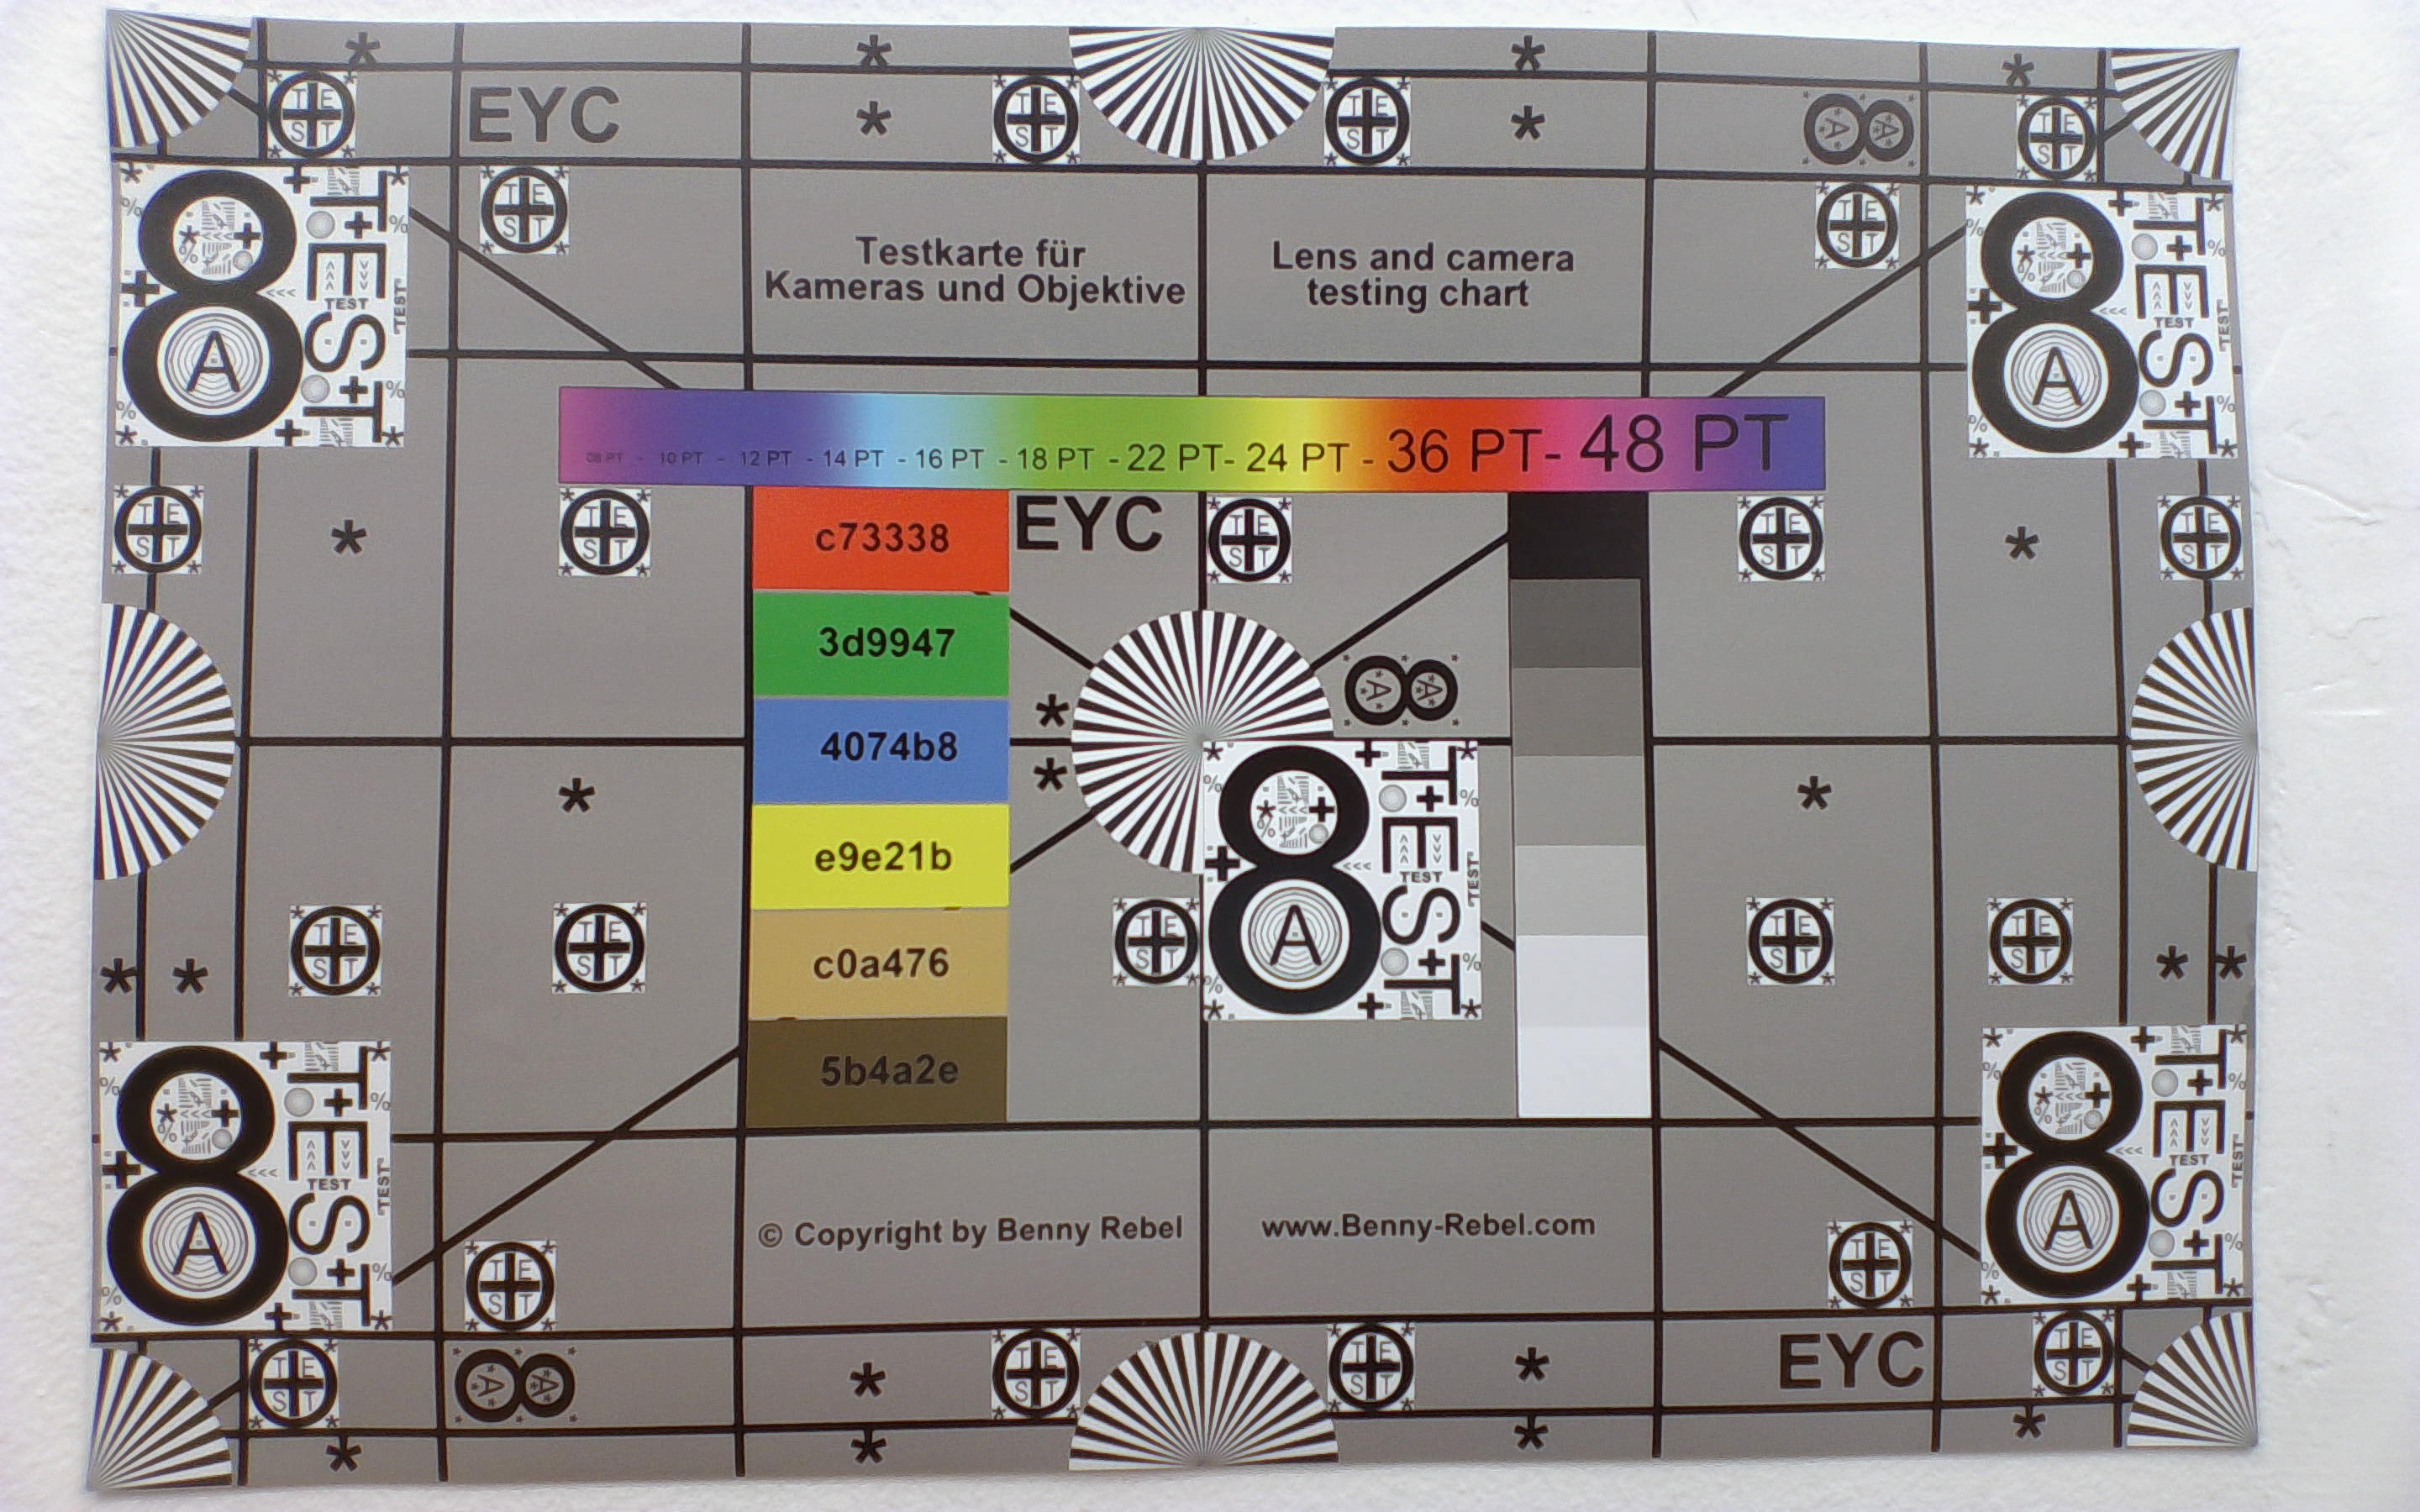
A base 5 MP webcam comes standard with the option to upgrade to 10 MP.
Maintenance
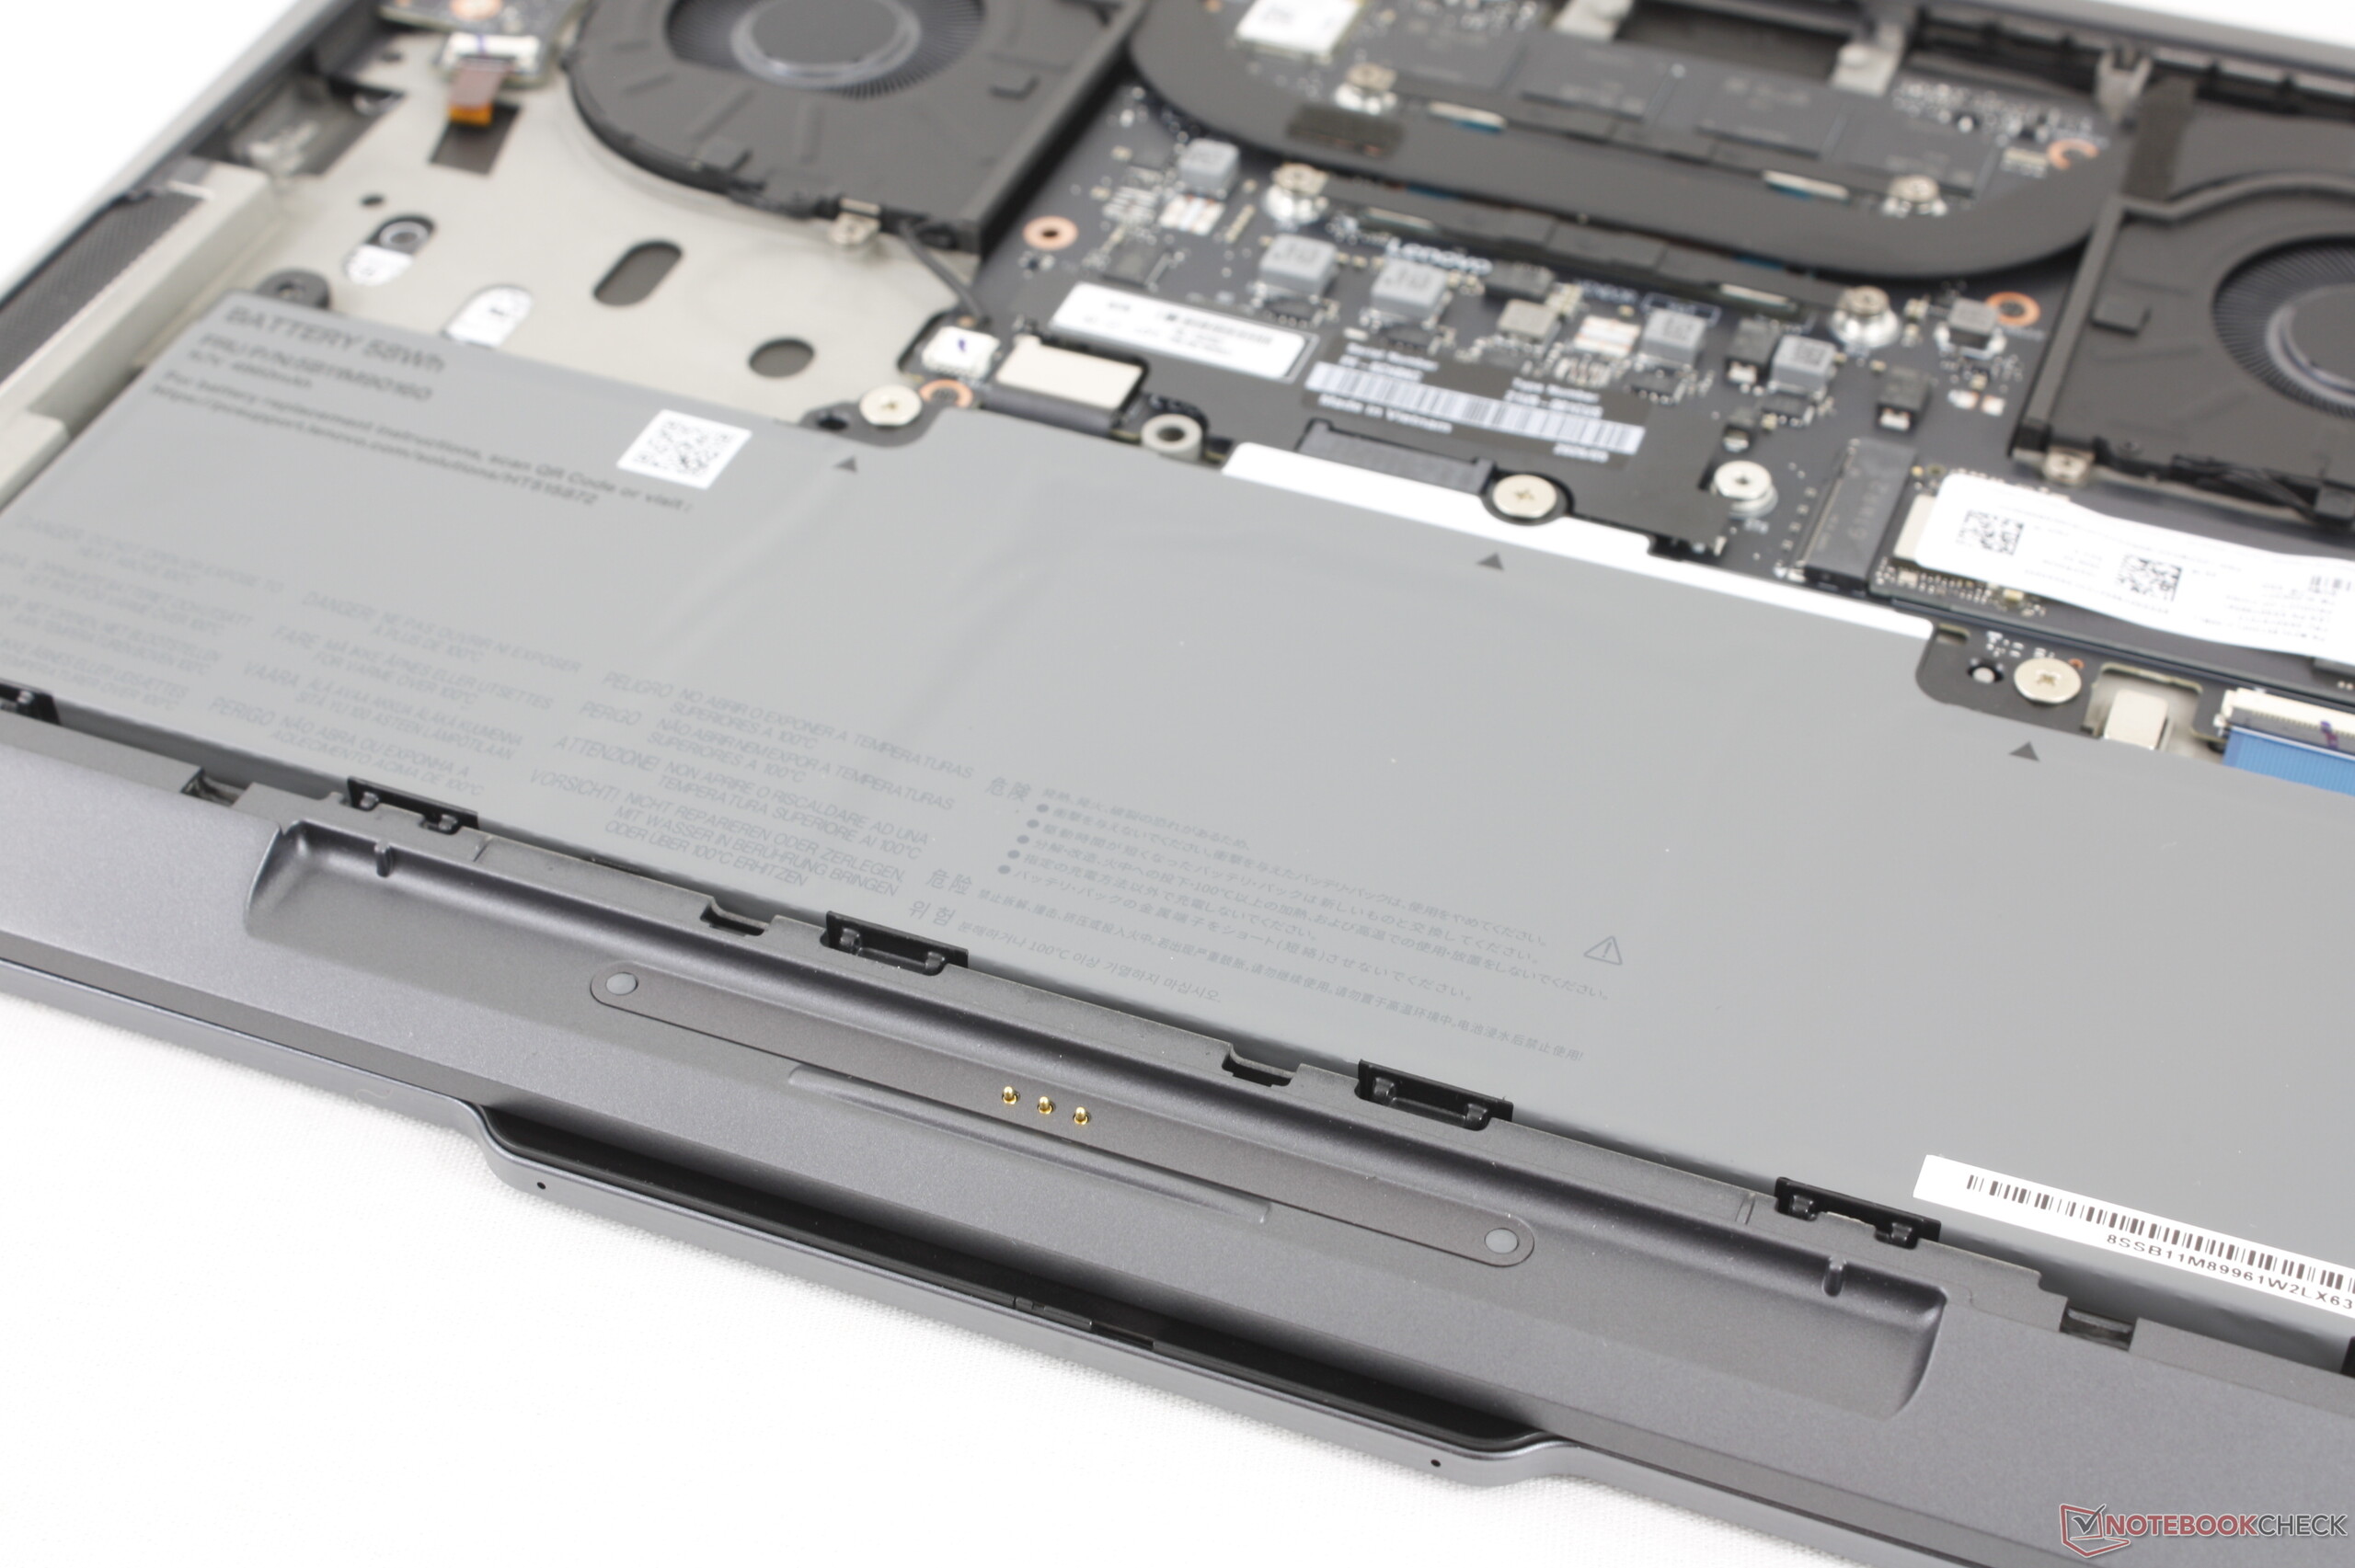
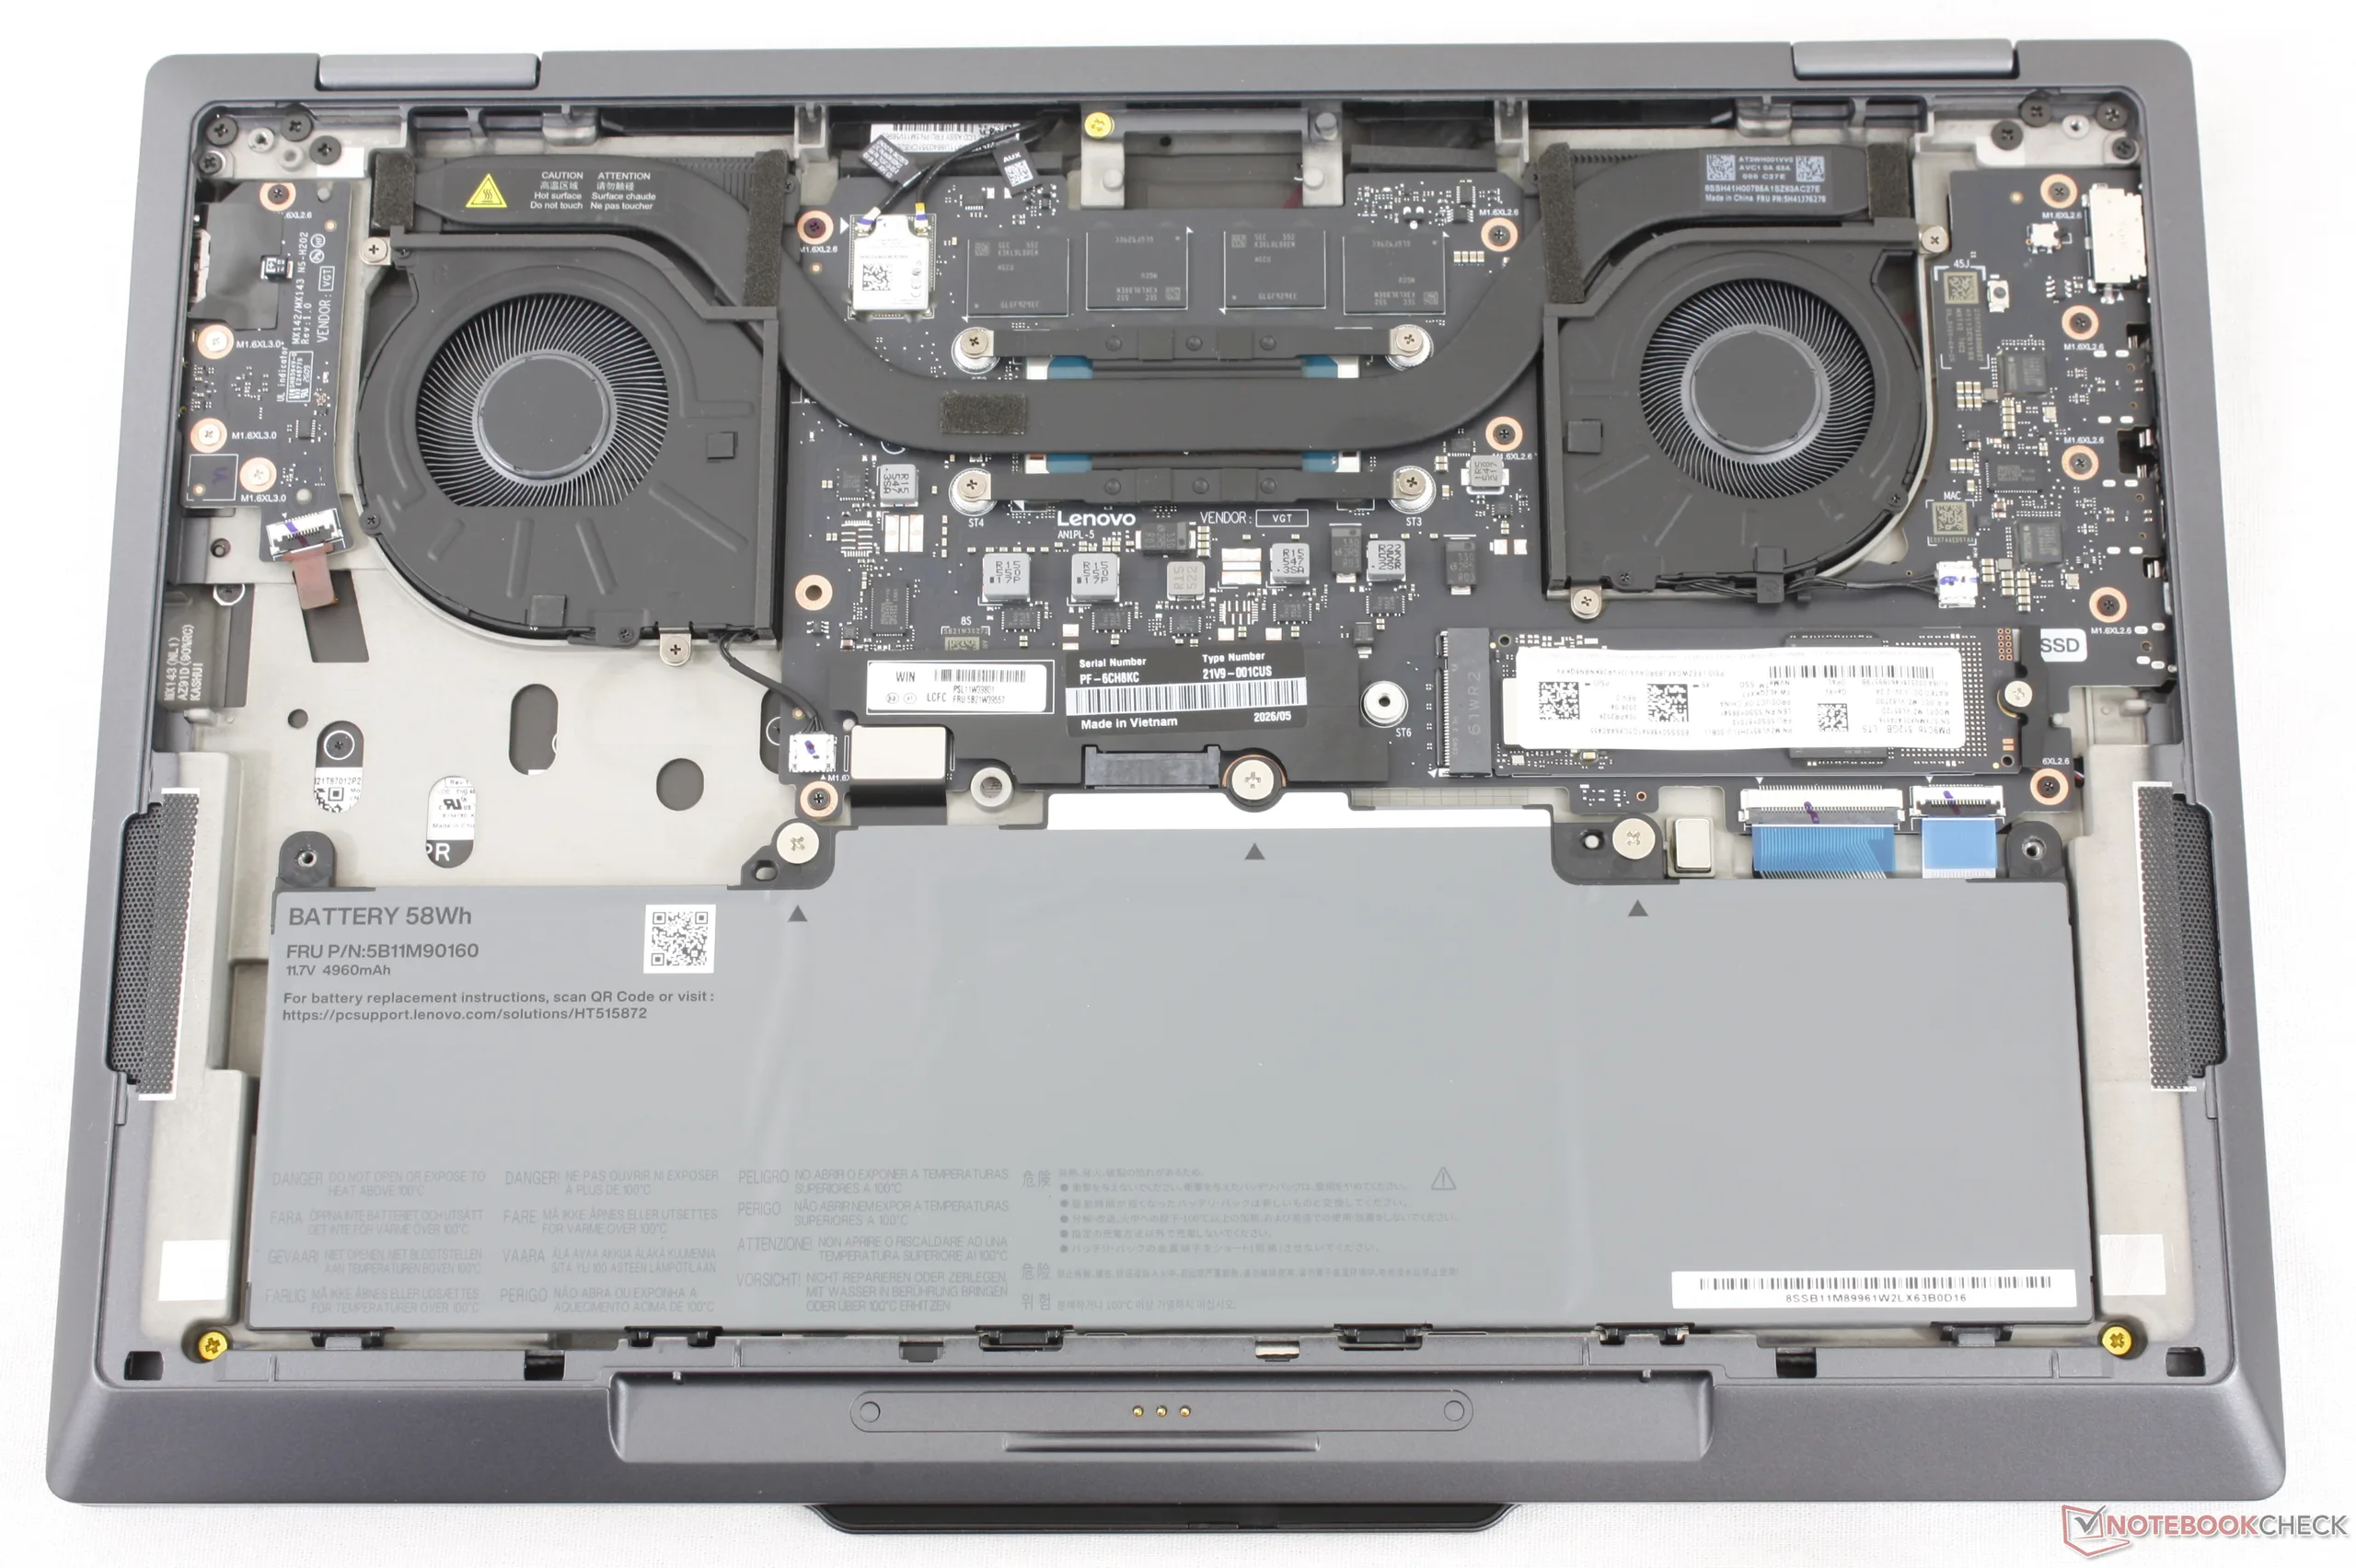
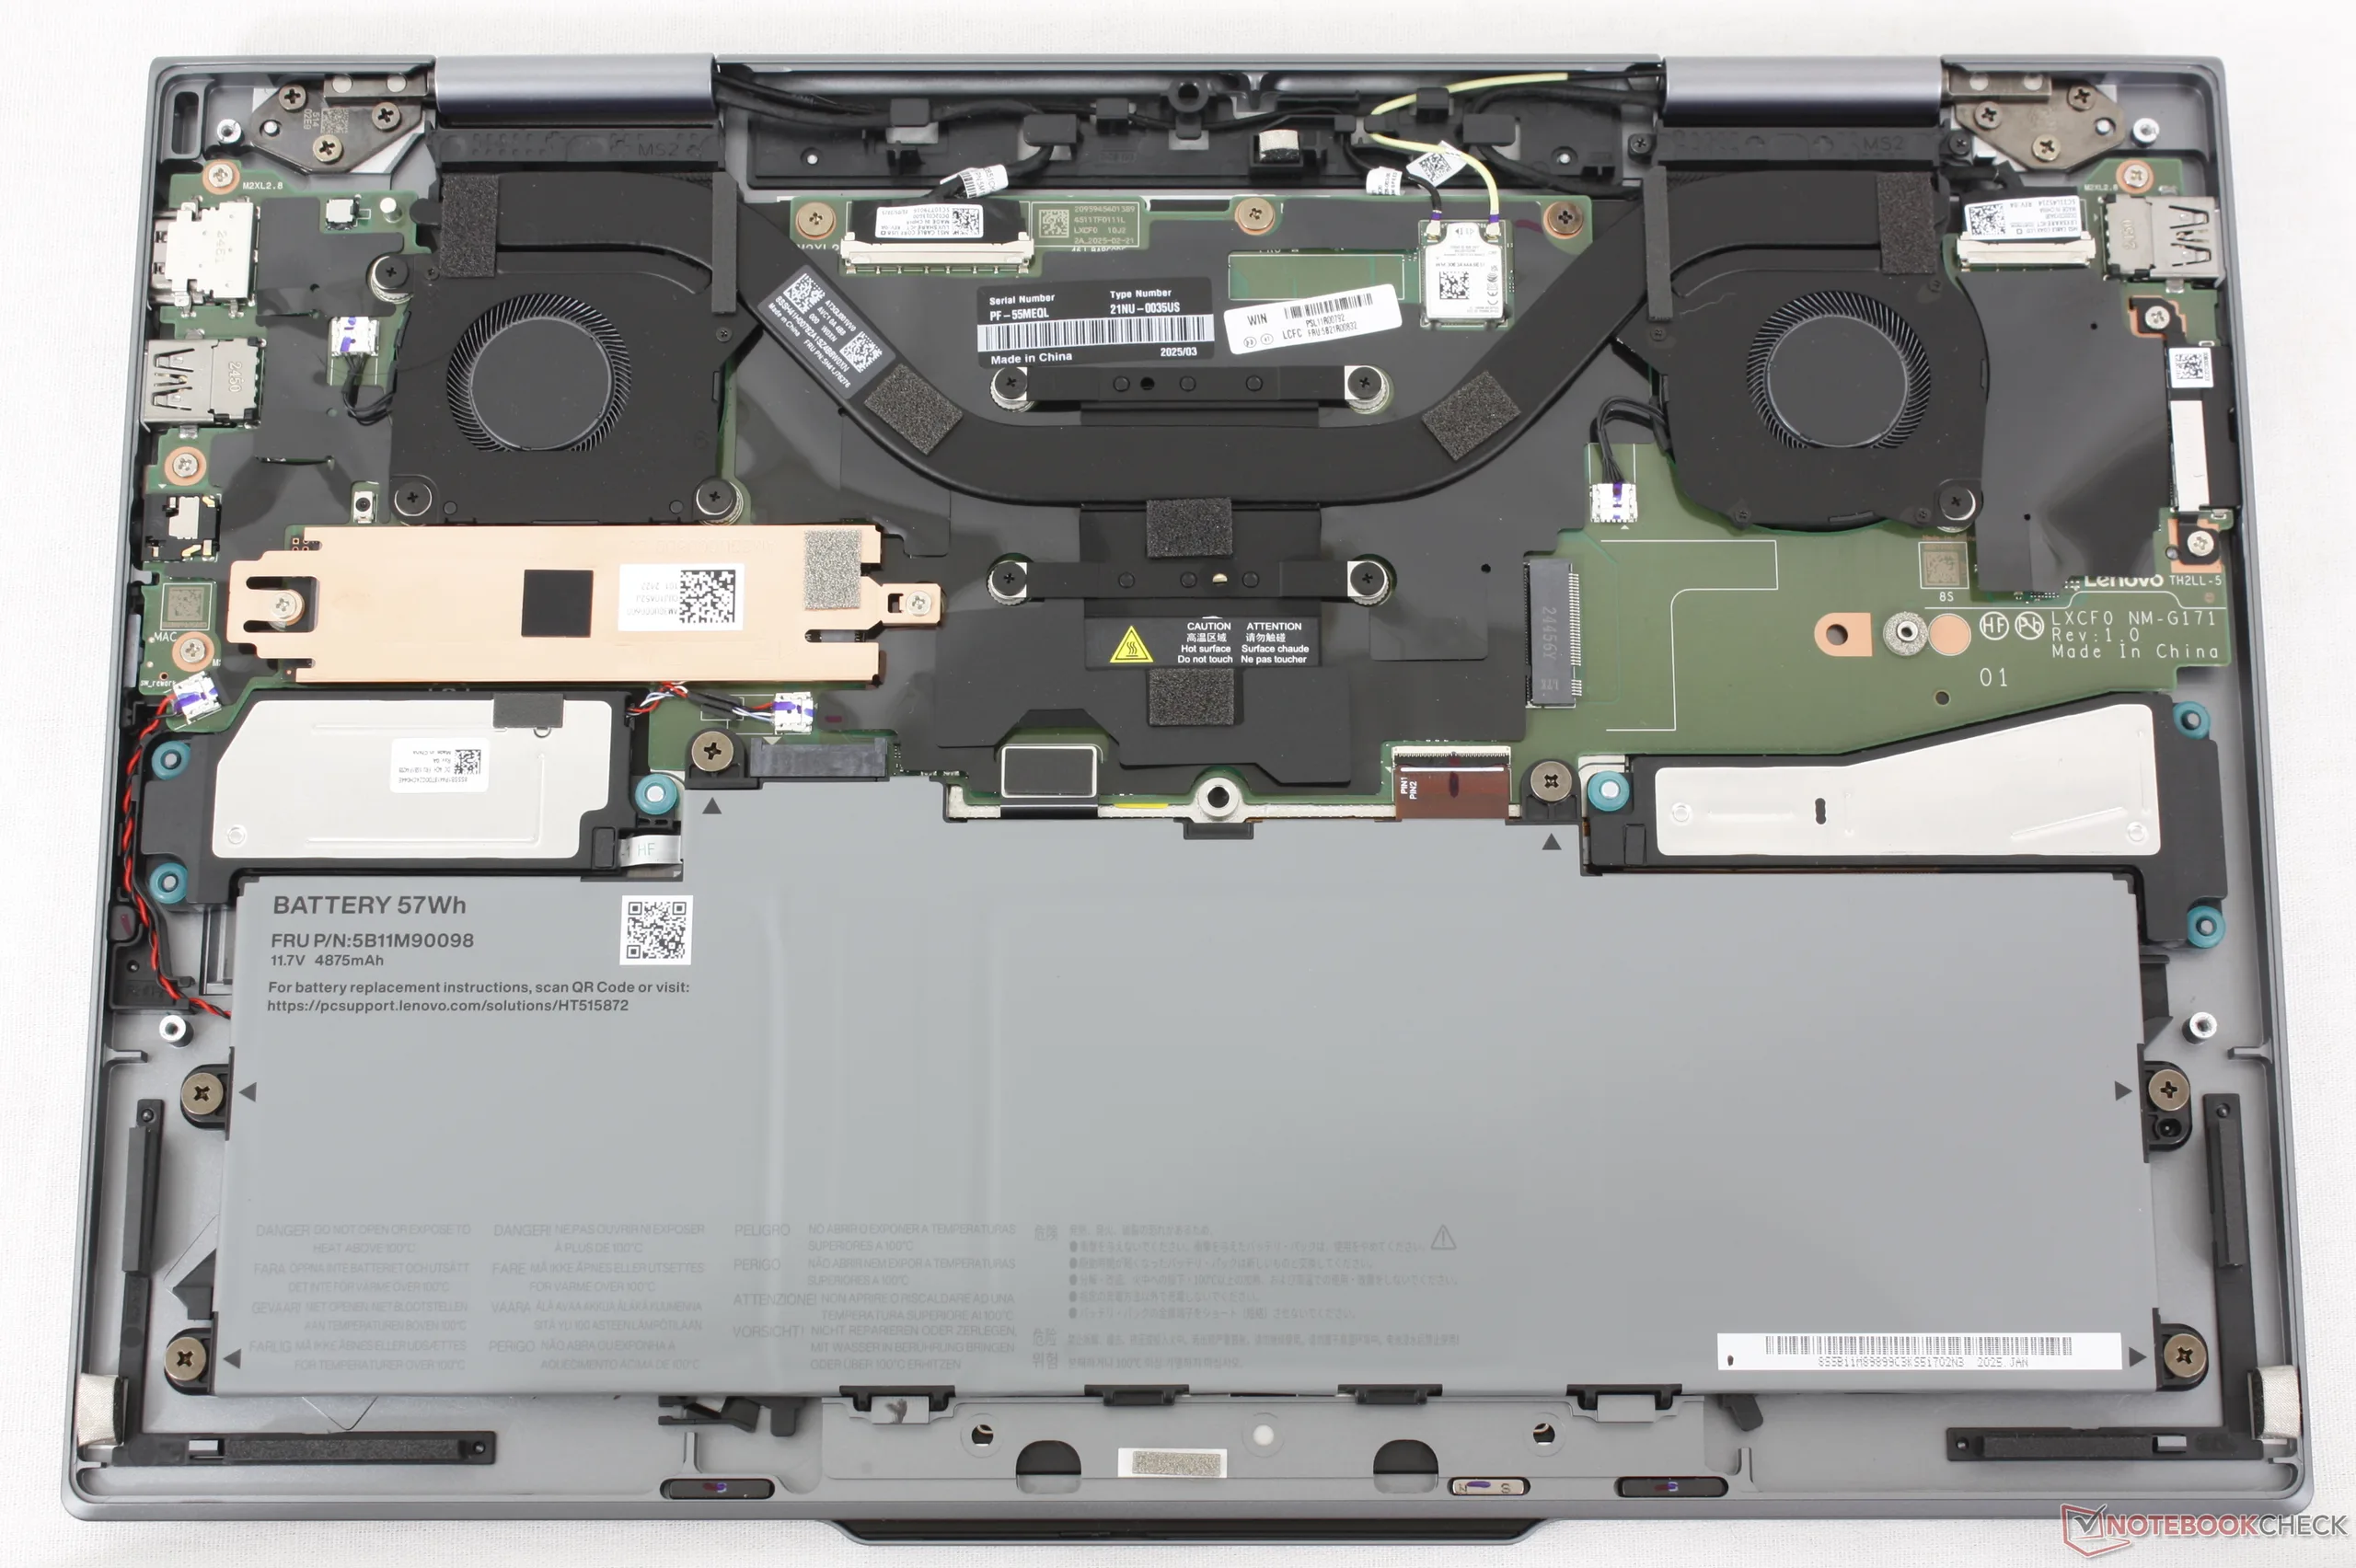
The bottom panel is easily serviceable with just a Phillips screwdriver. Upgrades are limited to the single M.2 2280 SSD slot.
Sustainability
The model makes extensive use of recycled materials including up to 90 percent recycled aluminum, steel, and magnesium and up to 65 percent PCC plastics depending on the part. The battery itself is 100 percent recycled cobalt and the packaging is plastic-free.
Accessories And Warranty
The optional Lenovo Slim Pen 2 is slimmer than the Yoga Pen that shipped with last year’s ThinkPad X1 2-in-1 Gen 10. The integrated recess for charging the Slim Pen 2 is therefore incompatible with last year’s pen.
The standard one-year limited manufacturer warranty applies.
Input Devices
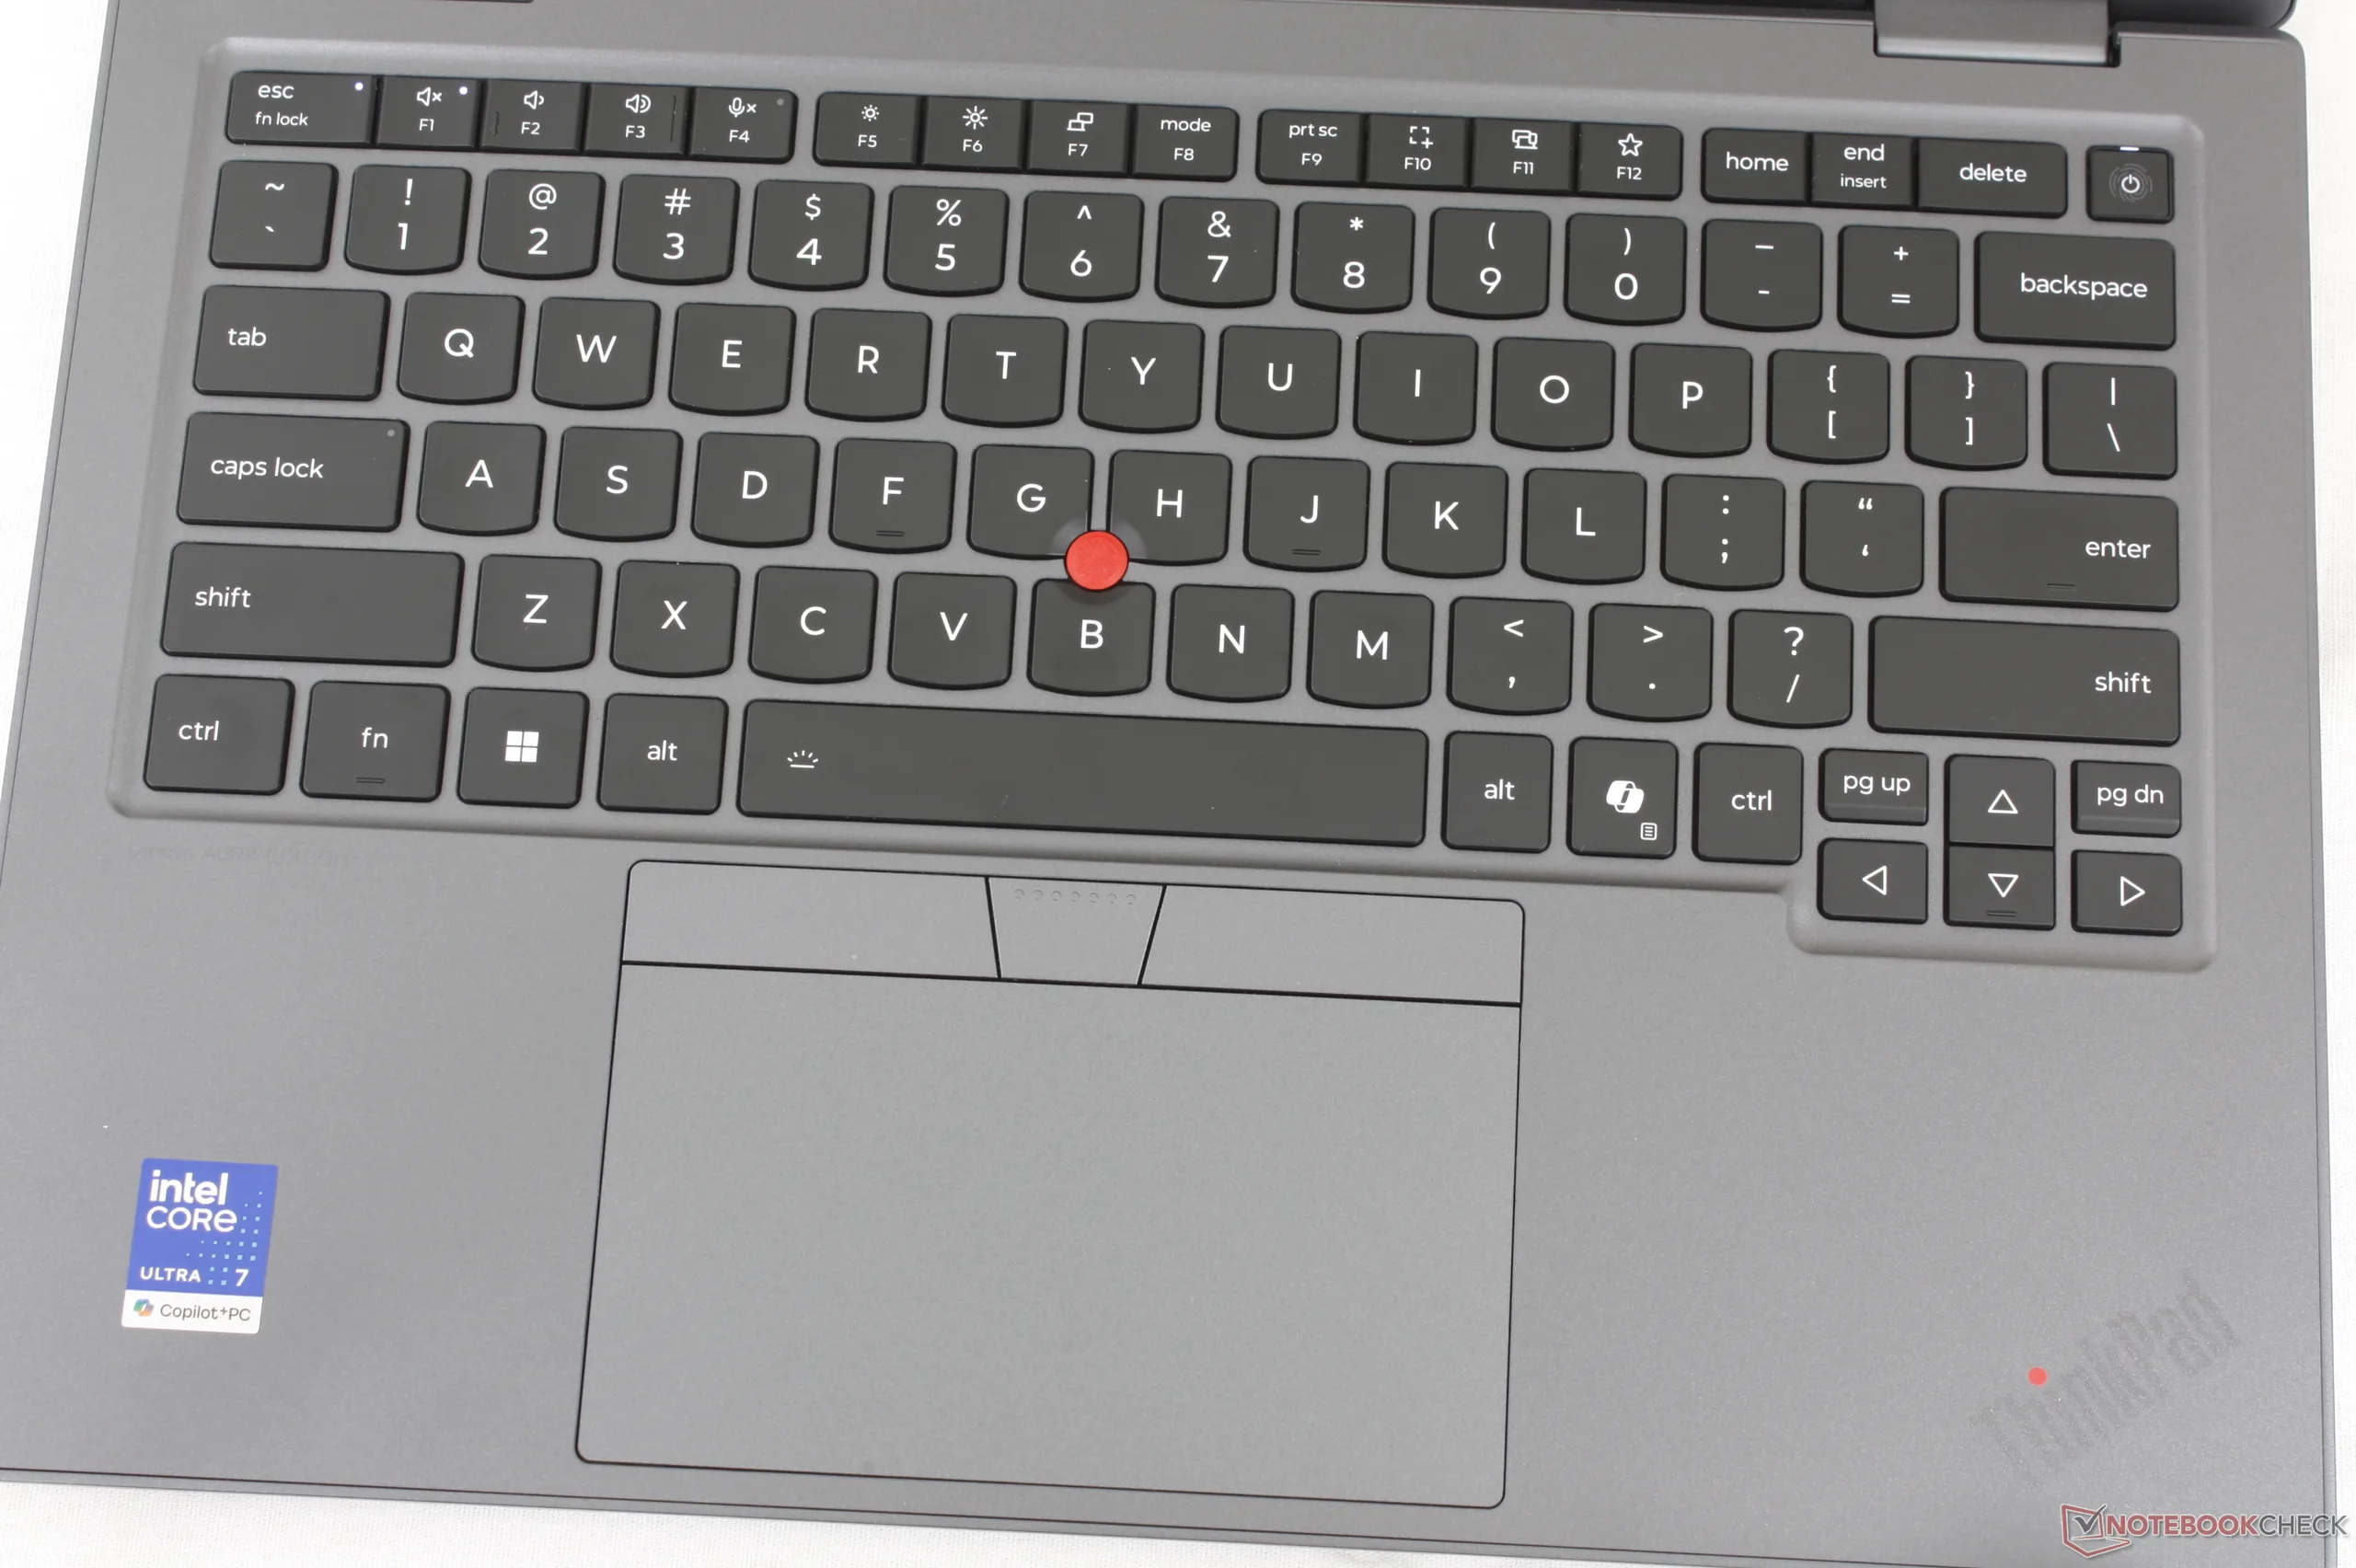
The dedicated fingerprint reader on last year’s model has been removed in favor of a small fingerprint-enabled Power button for this latest redesign.
Display
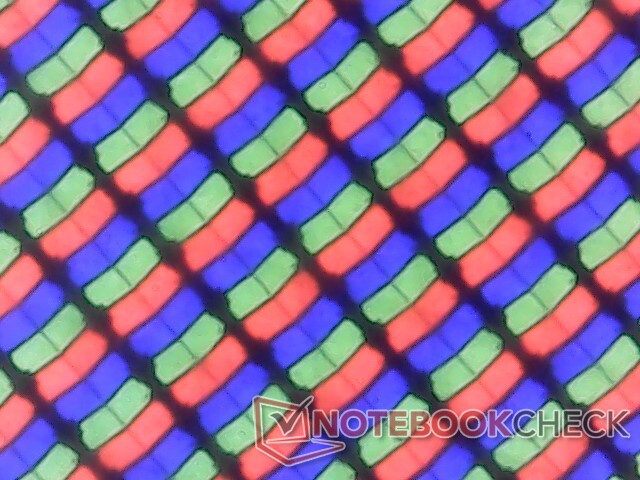
Lenovo offers two major touchscreen options much like on the previous generation model:
- 1920 x 1200, IPS, 60 Hz, 100% sRGB, 500 nits, Matte or glossy
- 2880 x 1800, OLED, 120 Hz, 100% DCI-P3, 500 nits, Glossy
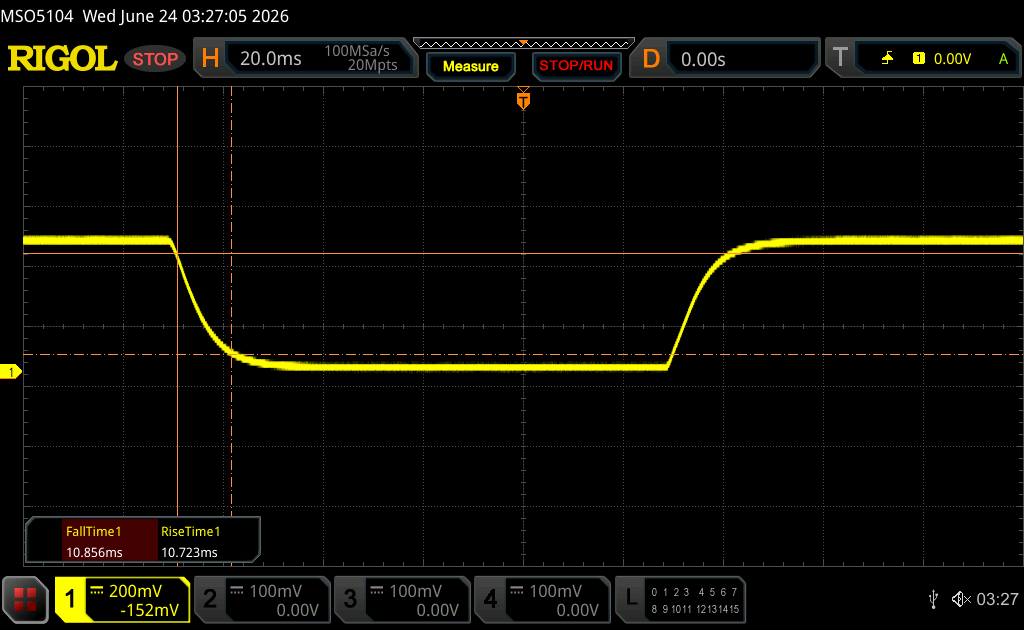
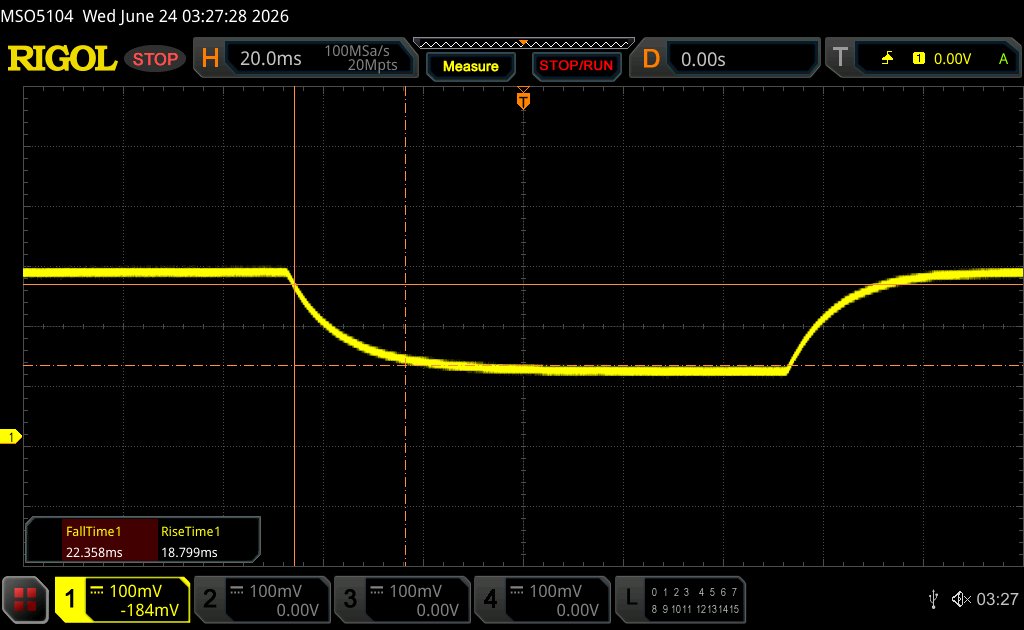
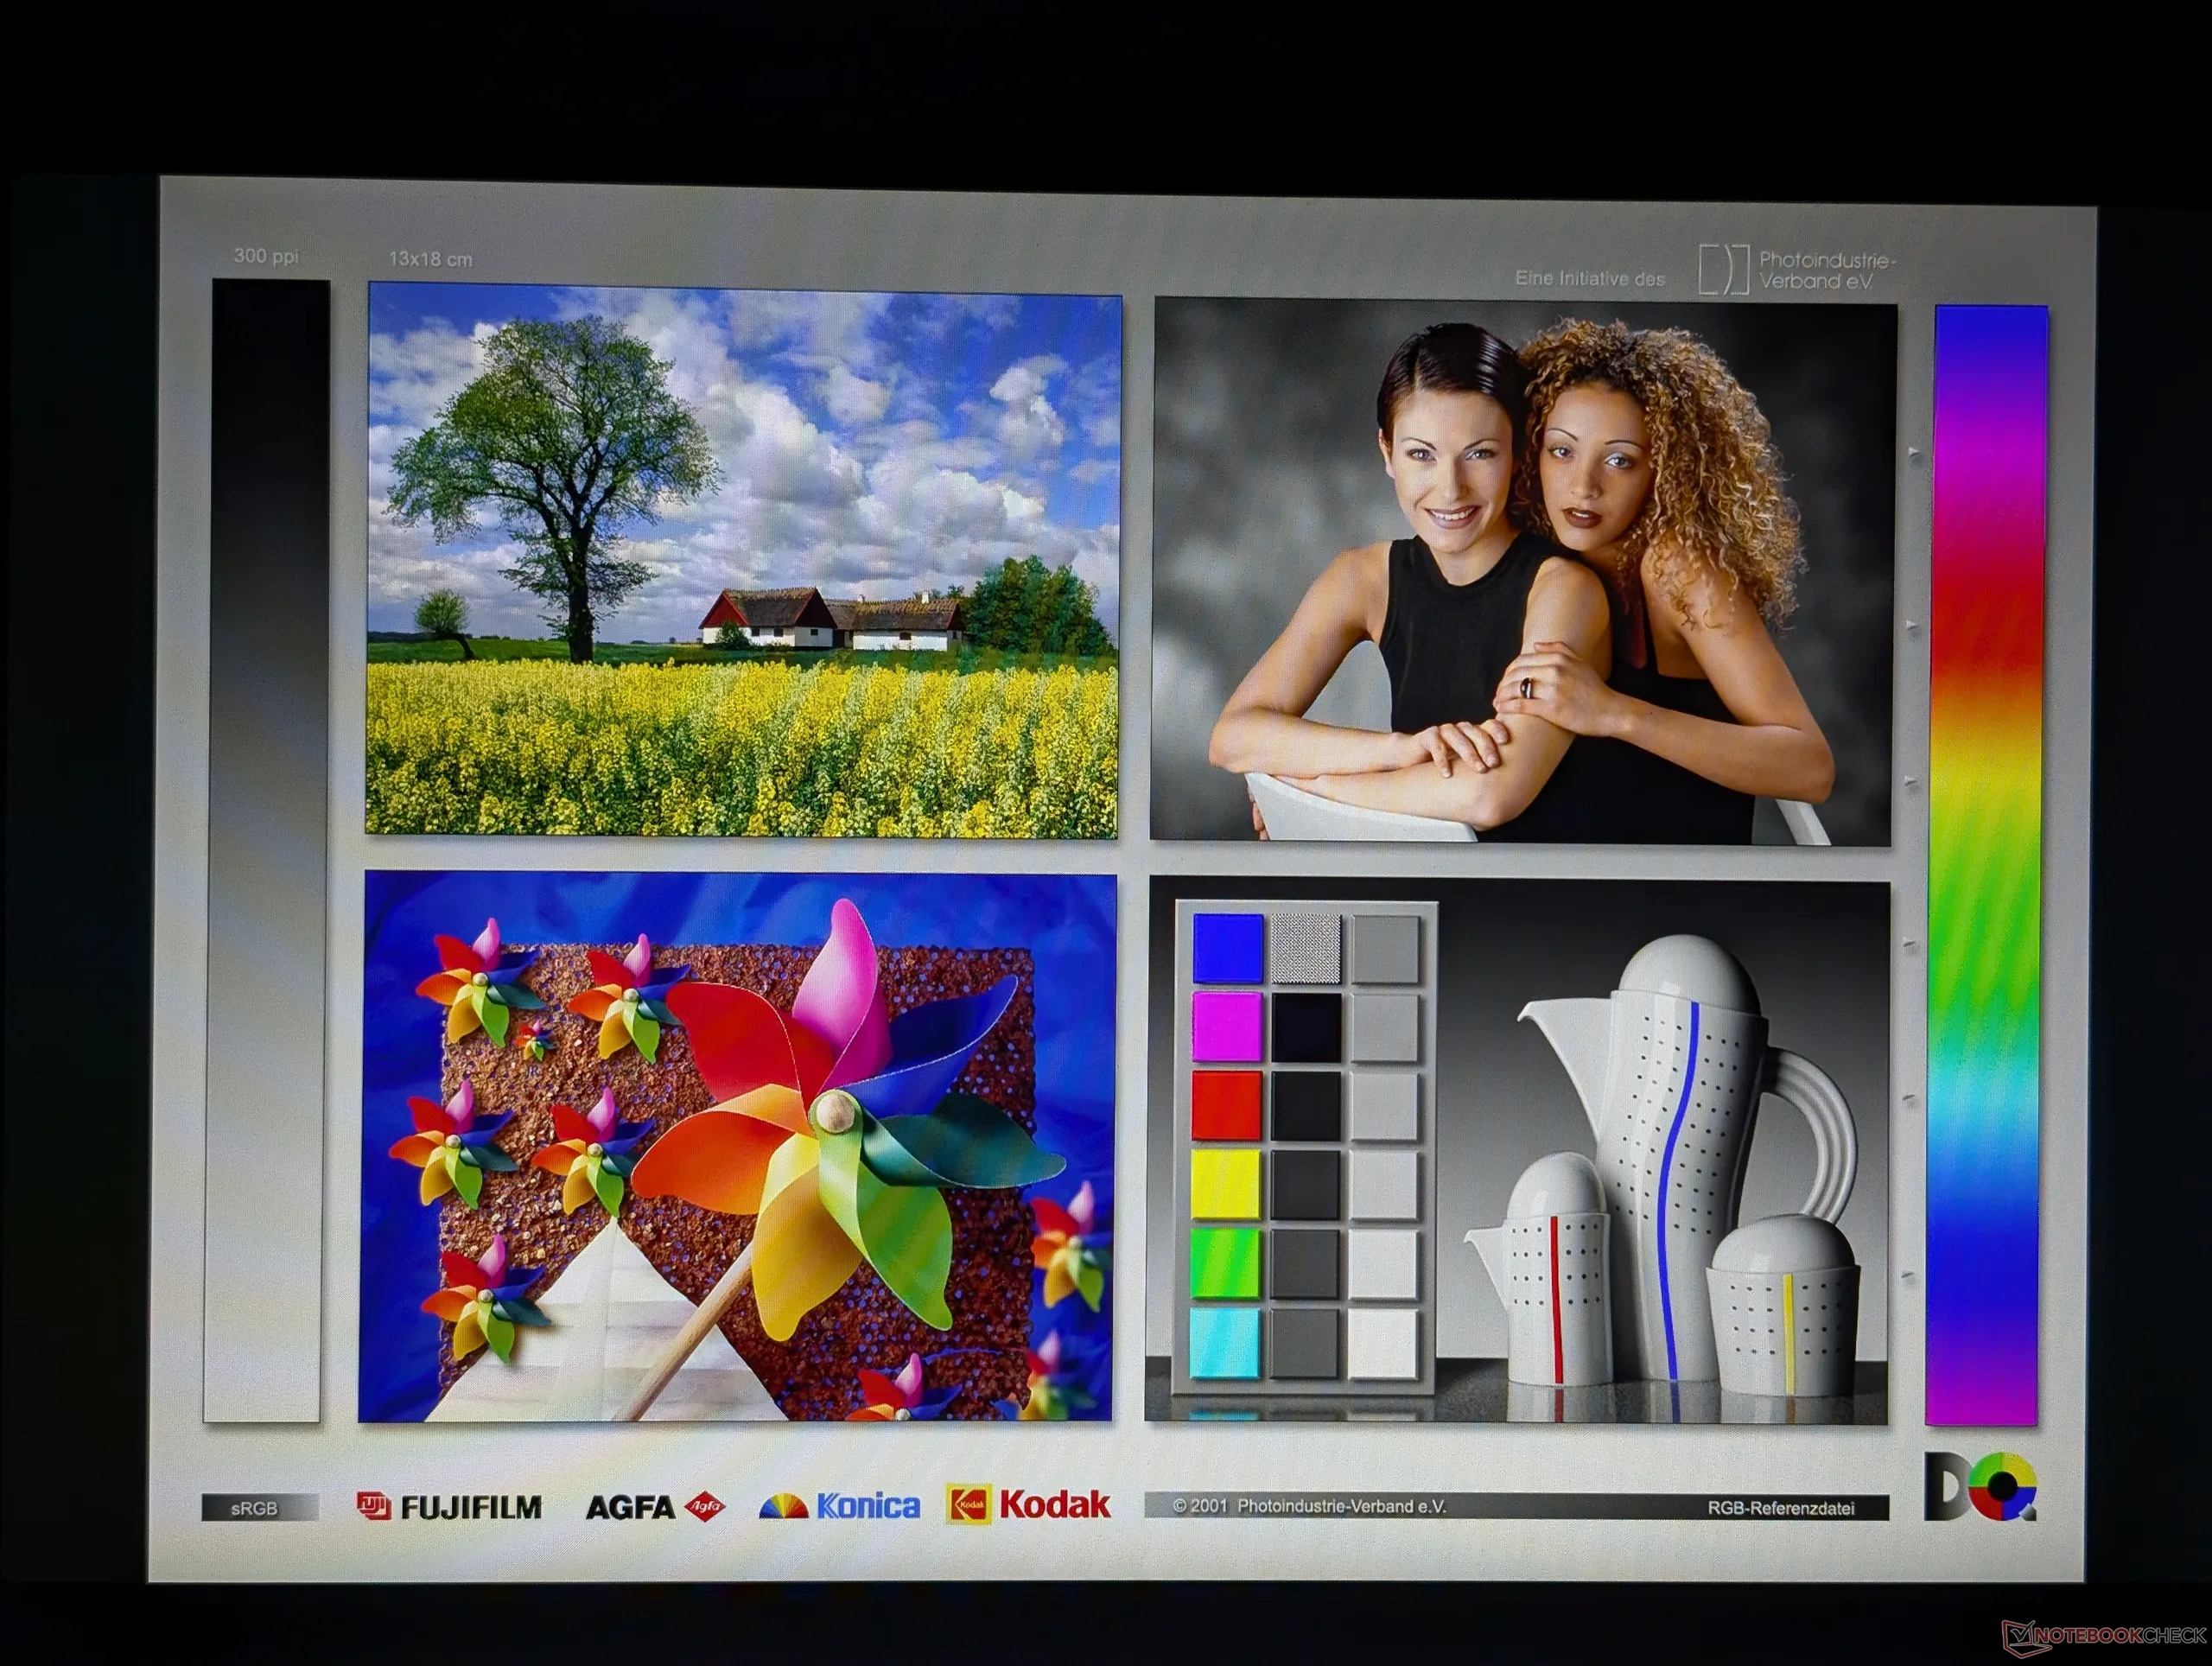
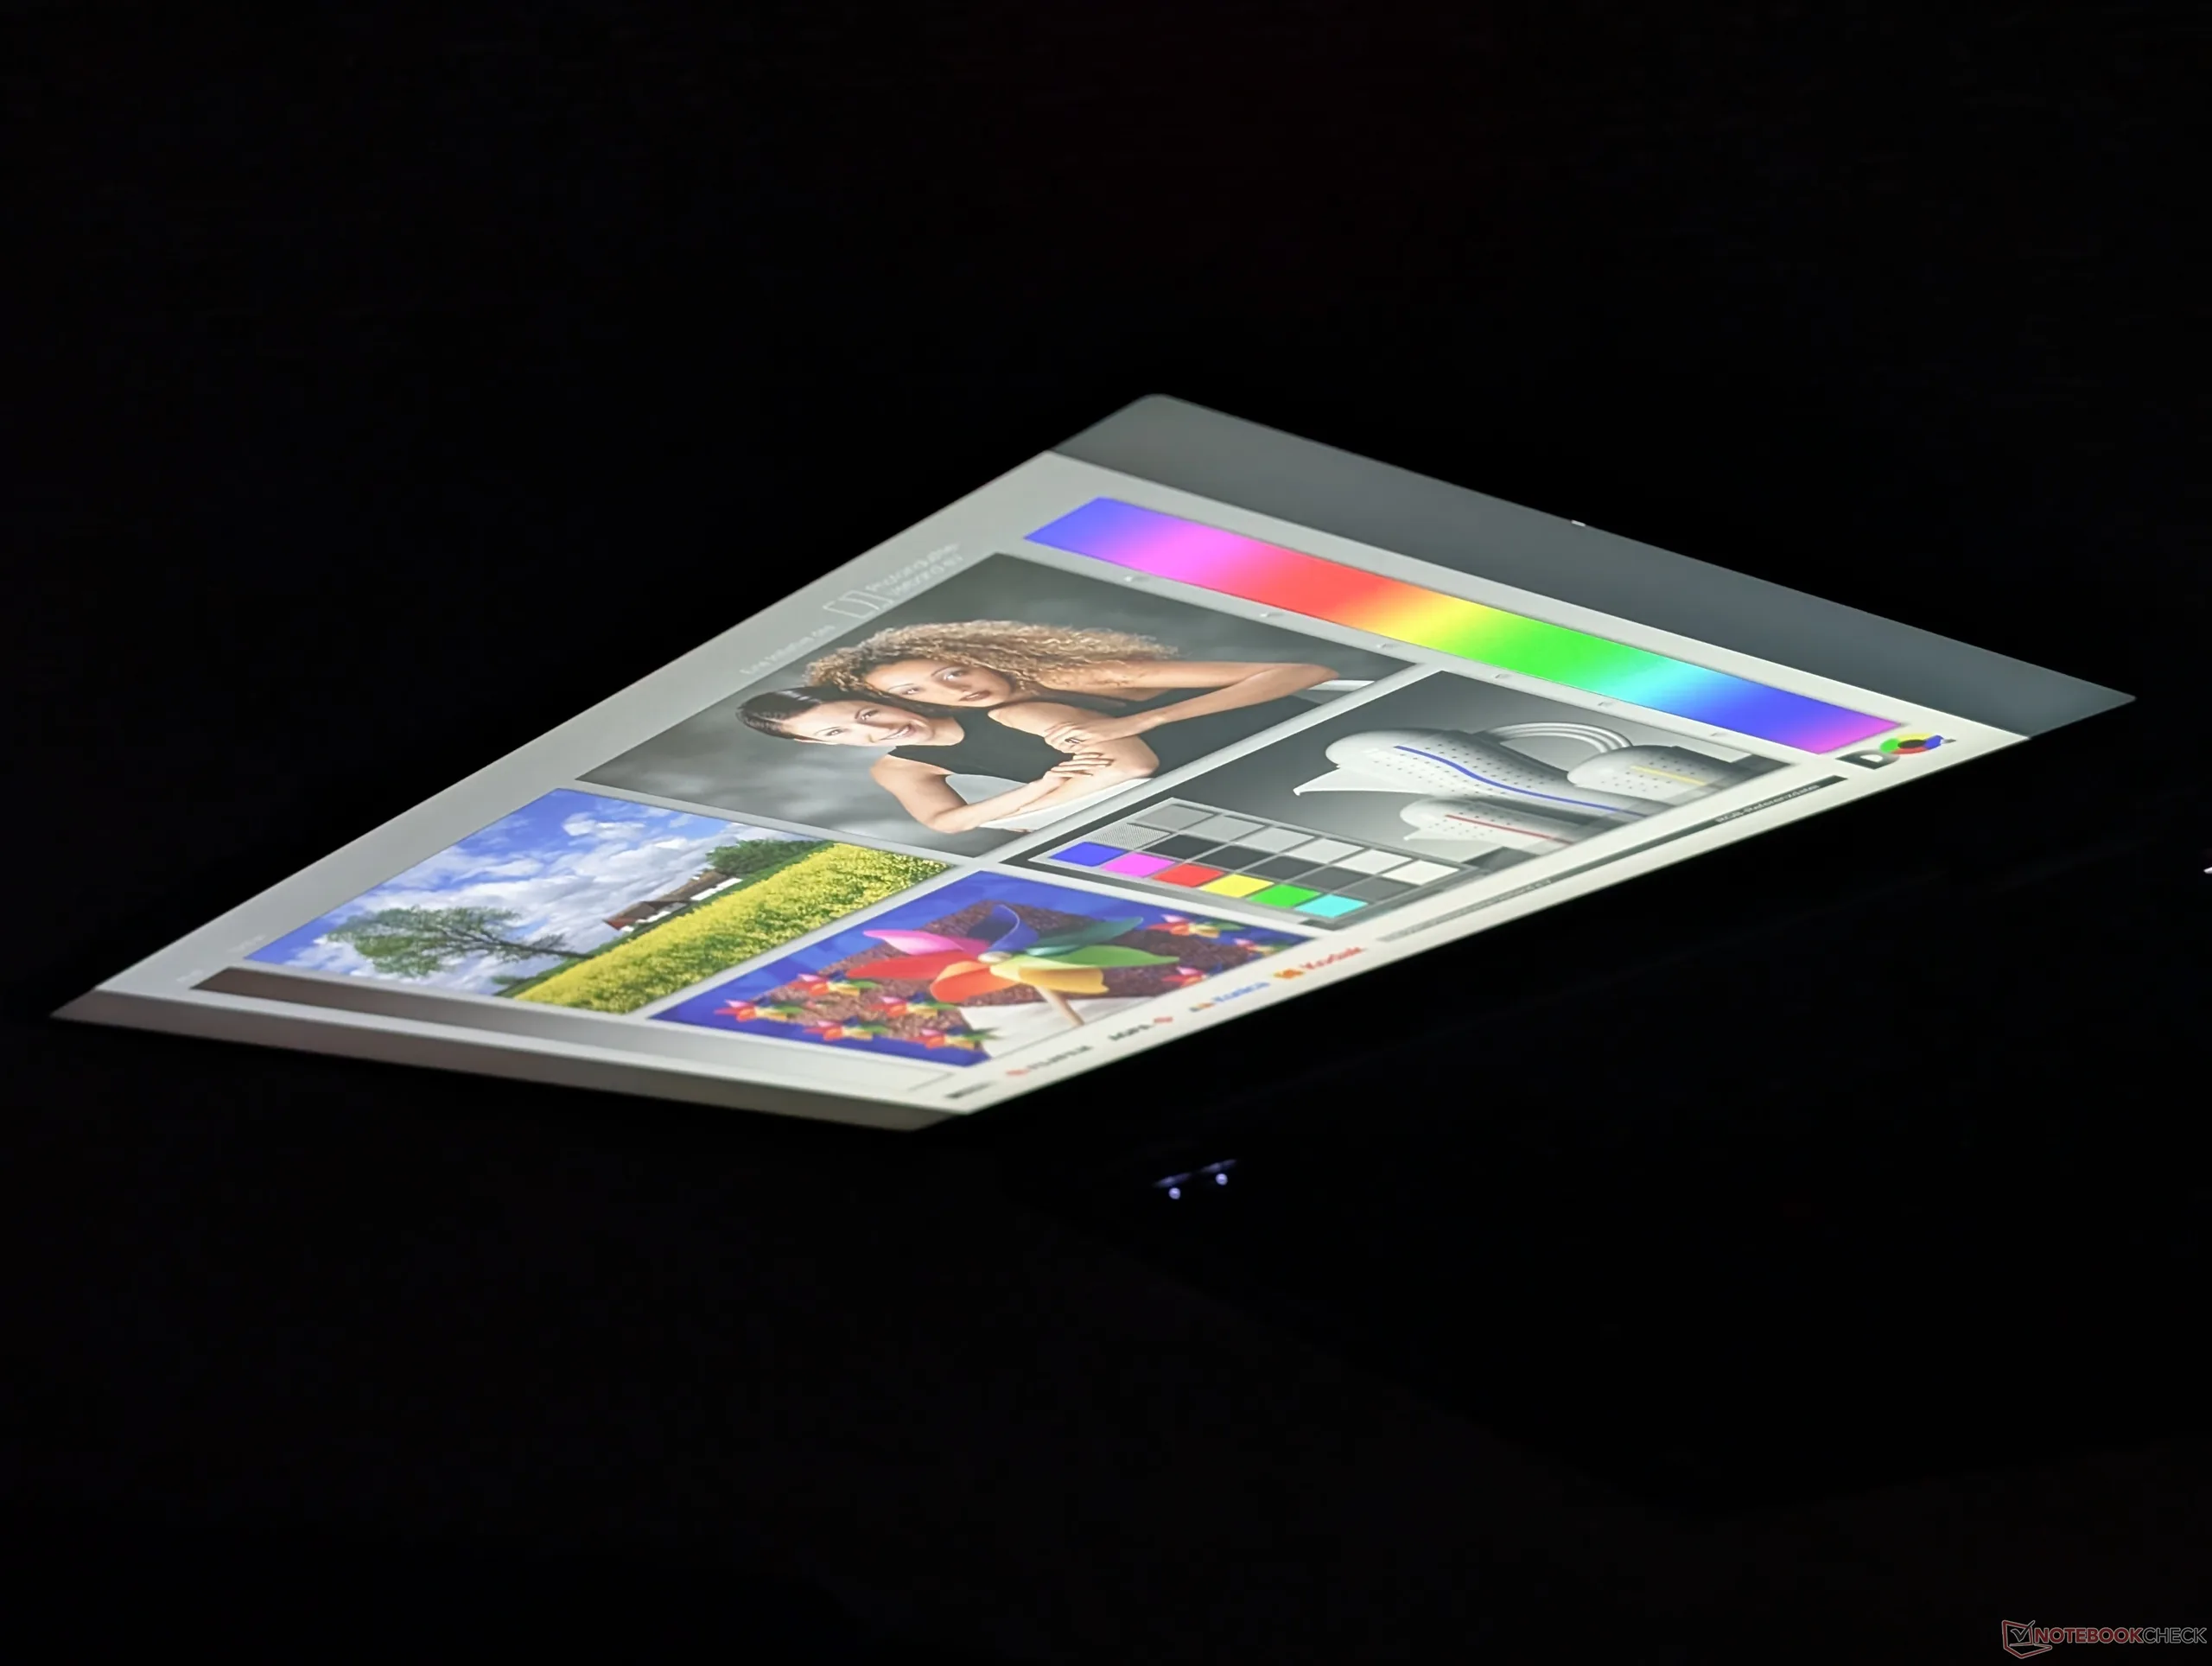
For our 1200p test unit, Lenovo has switched from the Innolux N140JLG-GT3 on last year’s model to the AUO B140UAN10.0. Core attributes are otherwise very nearly the same including their decent response times and contrast ratios.
| 510.5 cd/m²500.9 cd/m²490.4 cd/m²487.5 cd/m²527.7 cd/m²454.5 cd/m²481 cd/m²496.3 cd/m²460.6 cd/m² |
Distribution of brightness
AUO B140UAN10.0 tested with X-Rite i1Pro 3
Maximum: 527.7 cd/m² (Nits) Average: 489.9 cd/m² Minimum: 5.42 cd/m²
Brightness Distribution: 86 %
Center on Battery: 527.7 cd/m²
Contrast: 1885:1 (Black: 0.28 cd/m²)
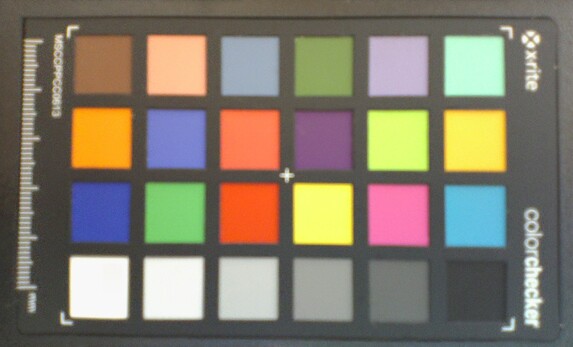
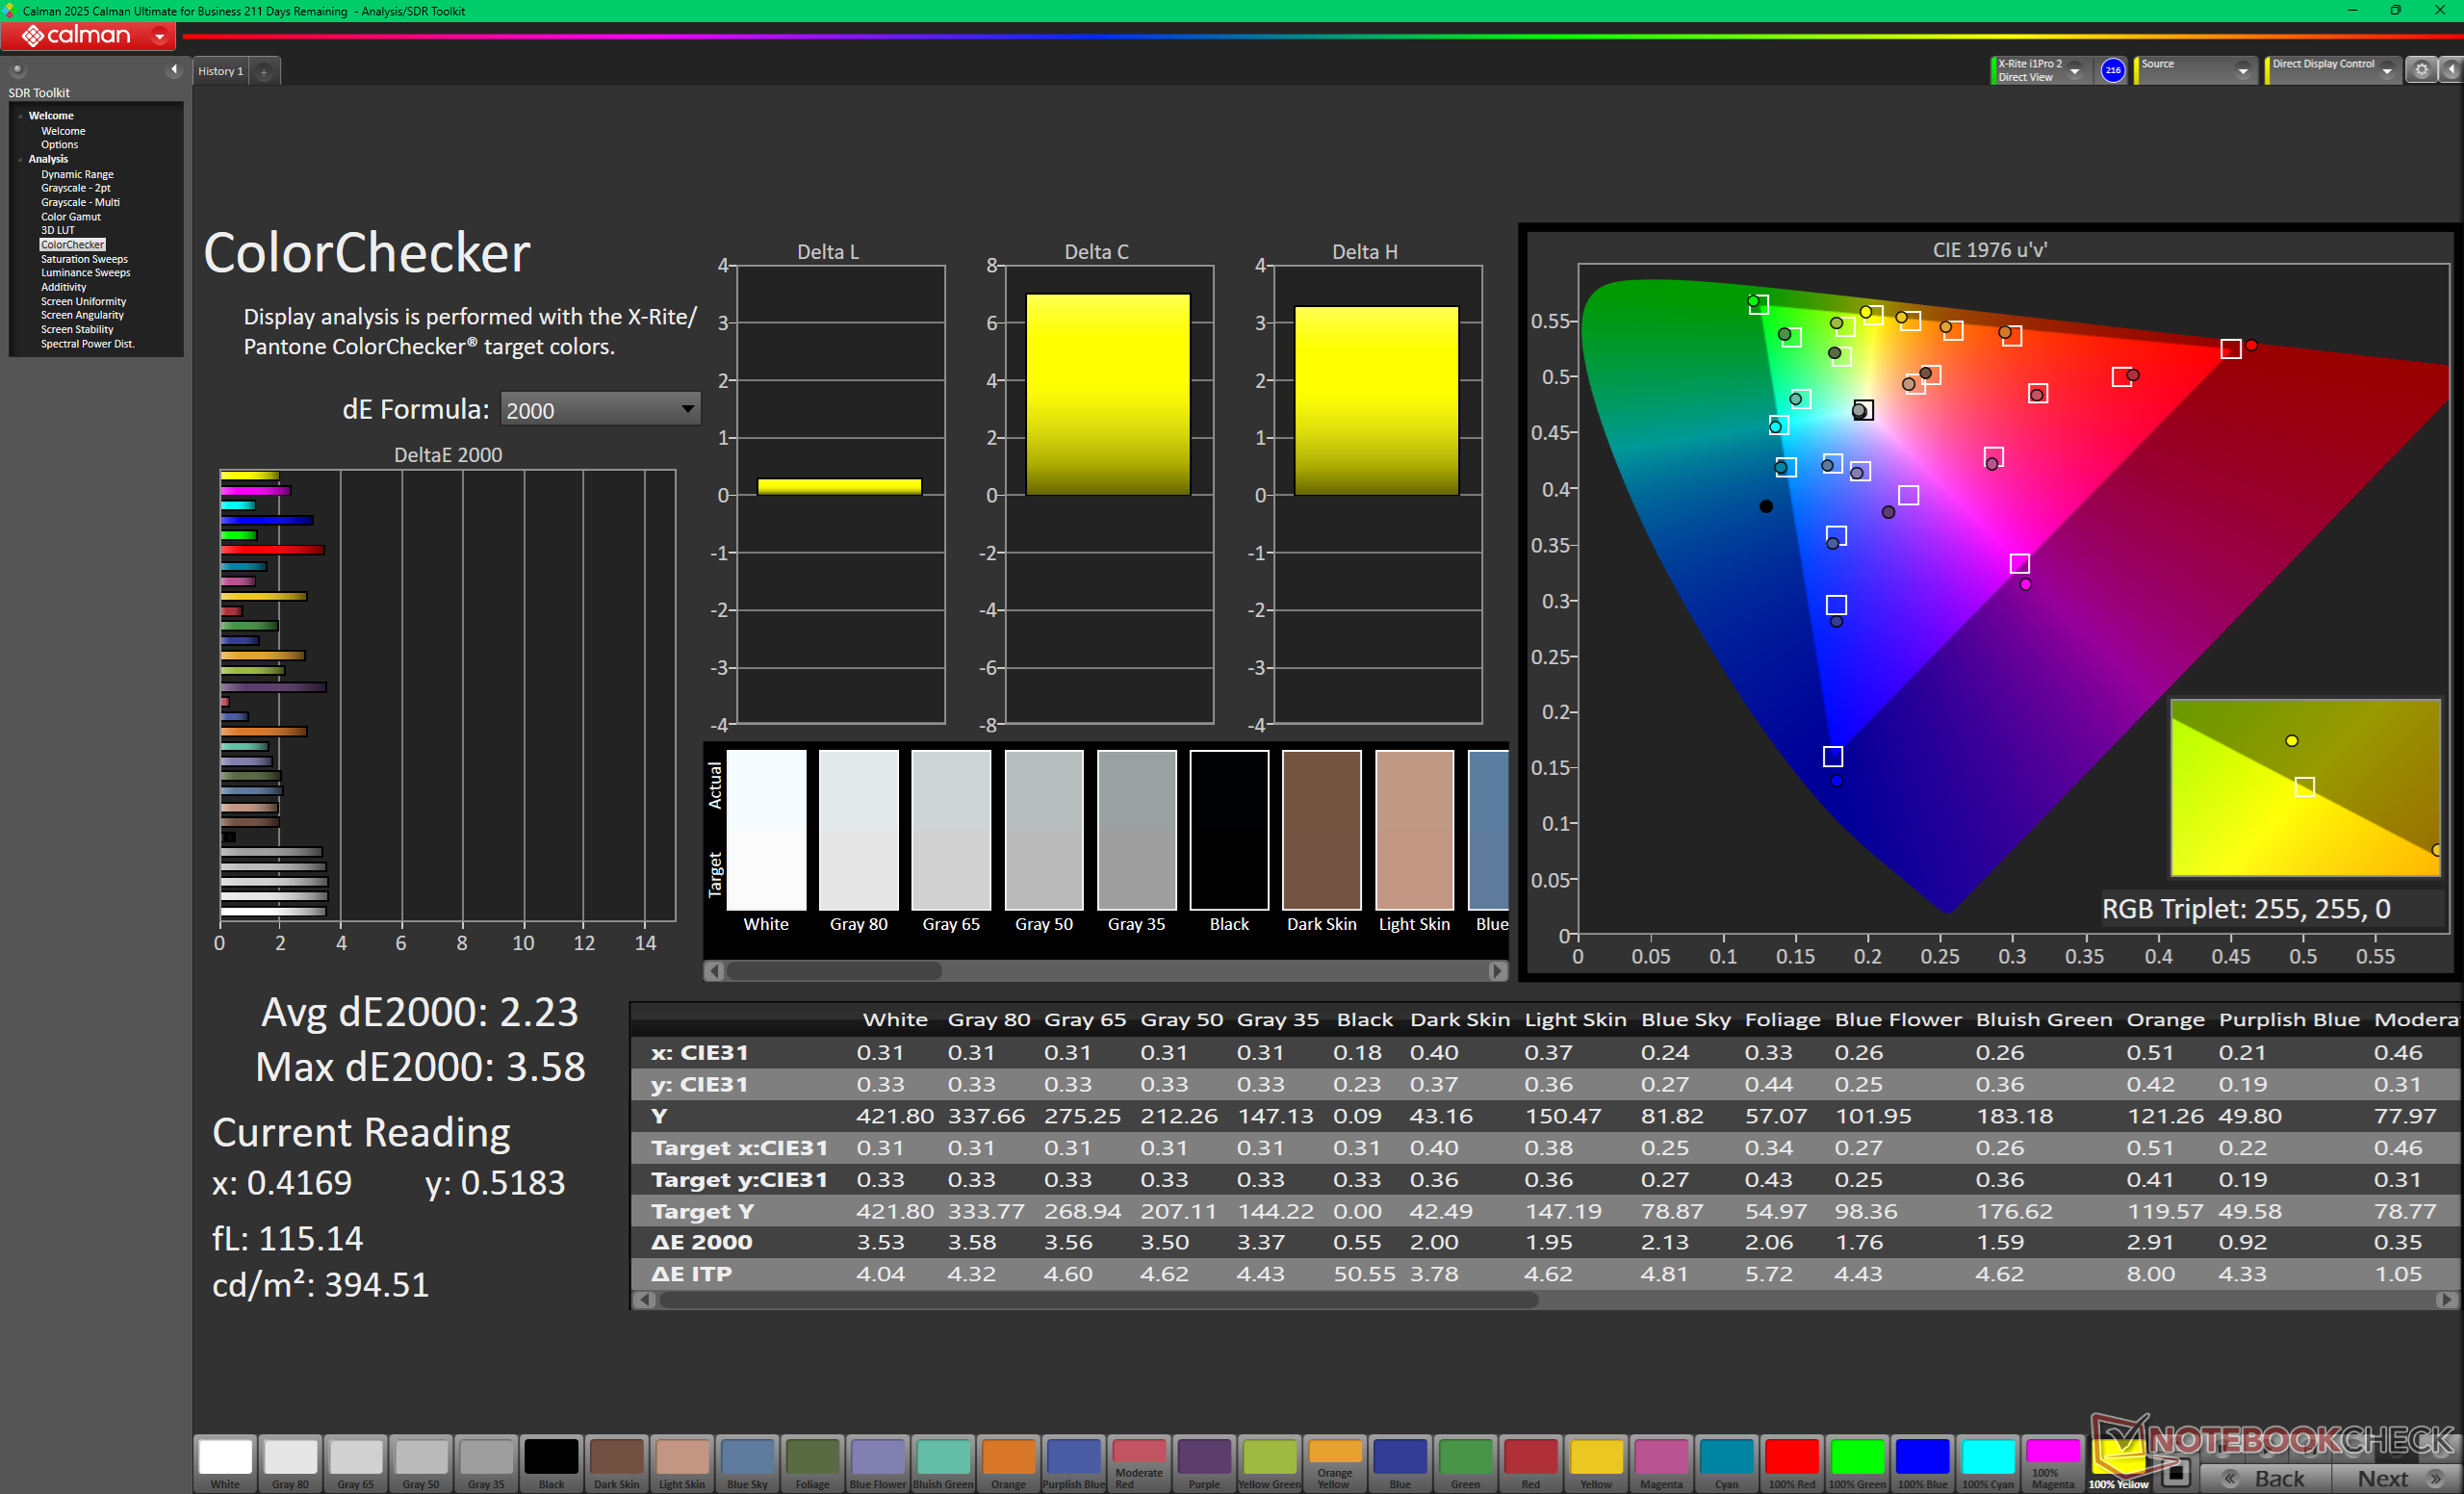
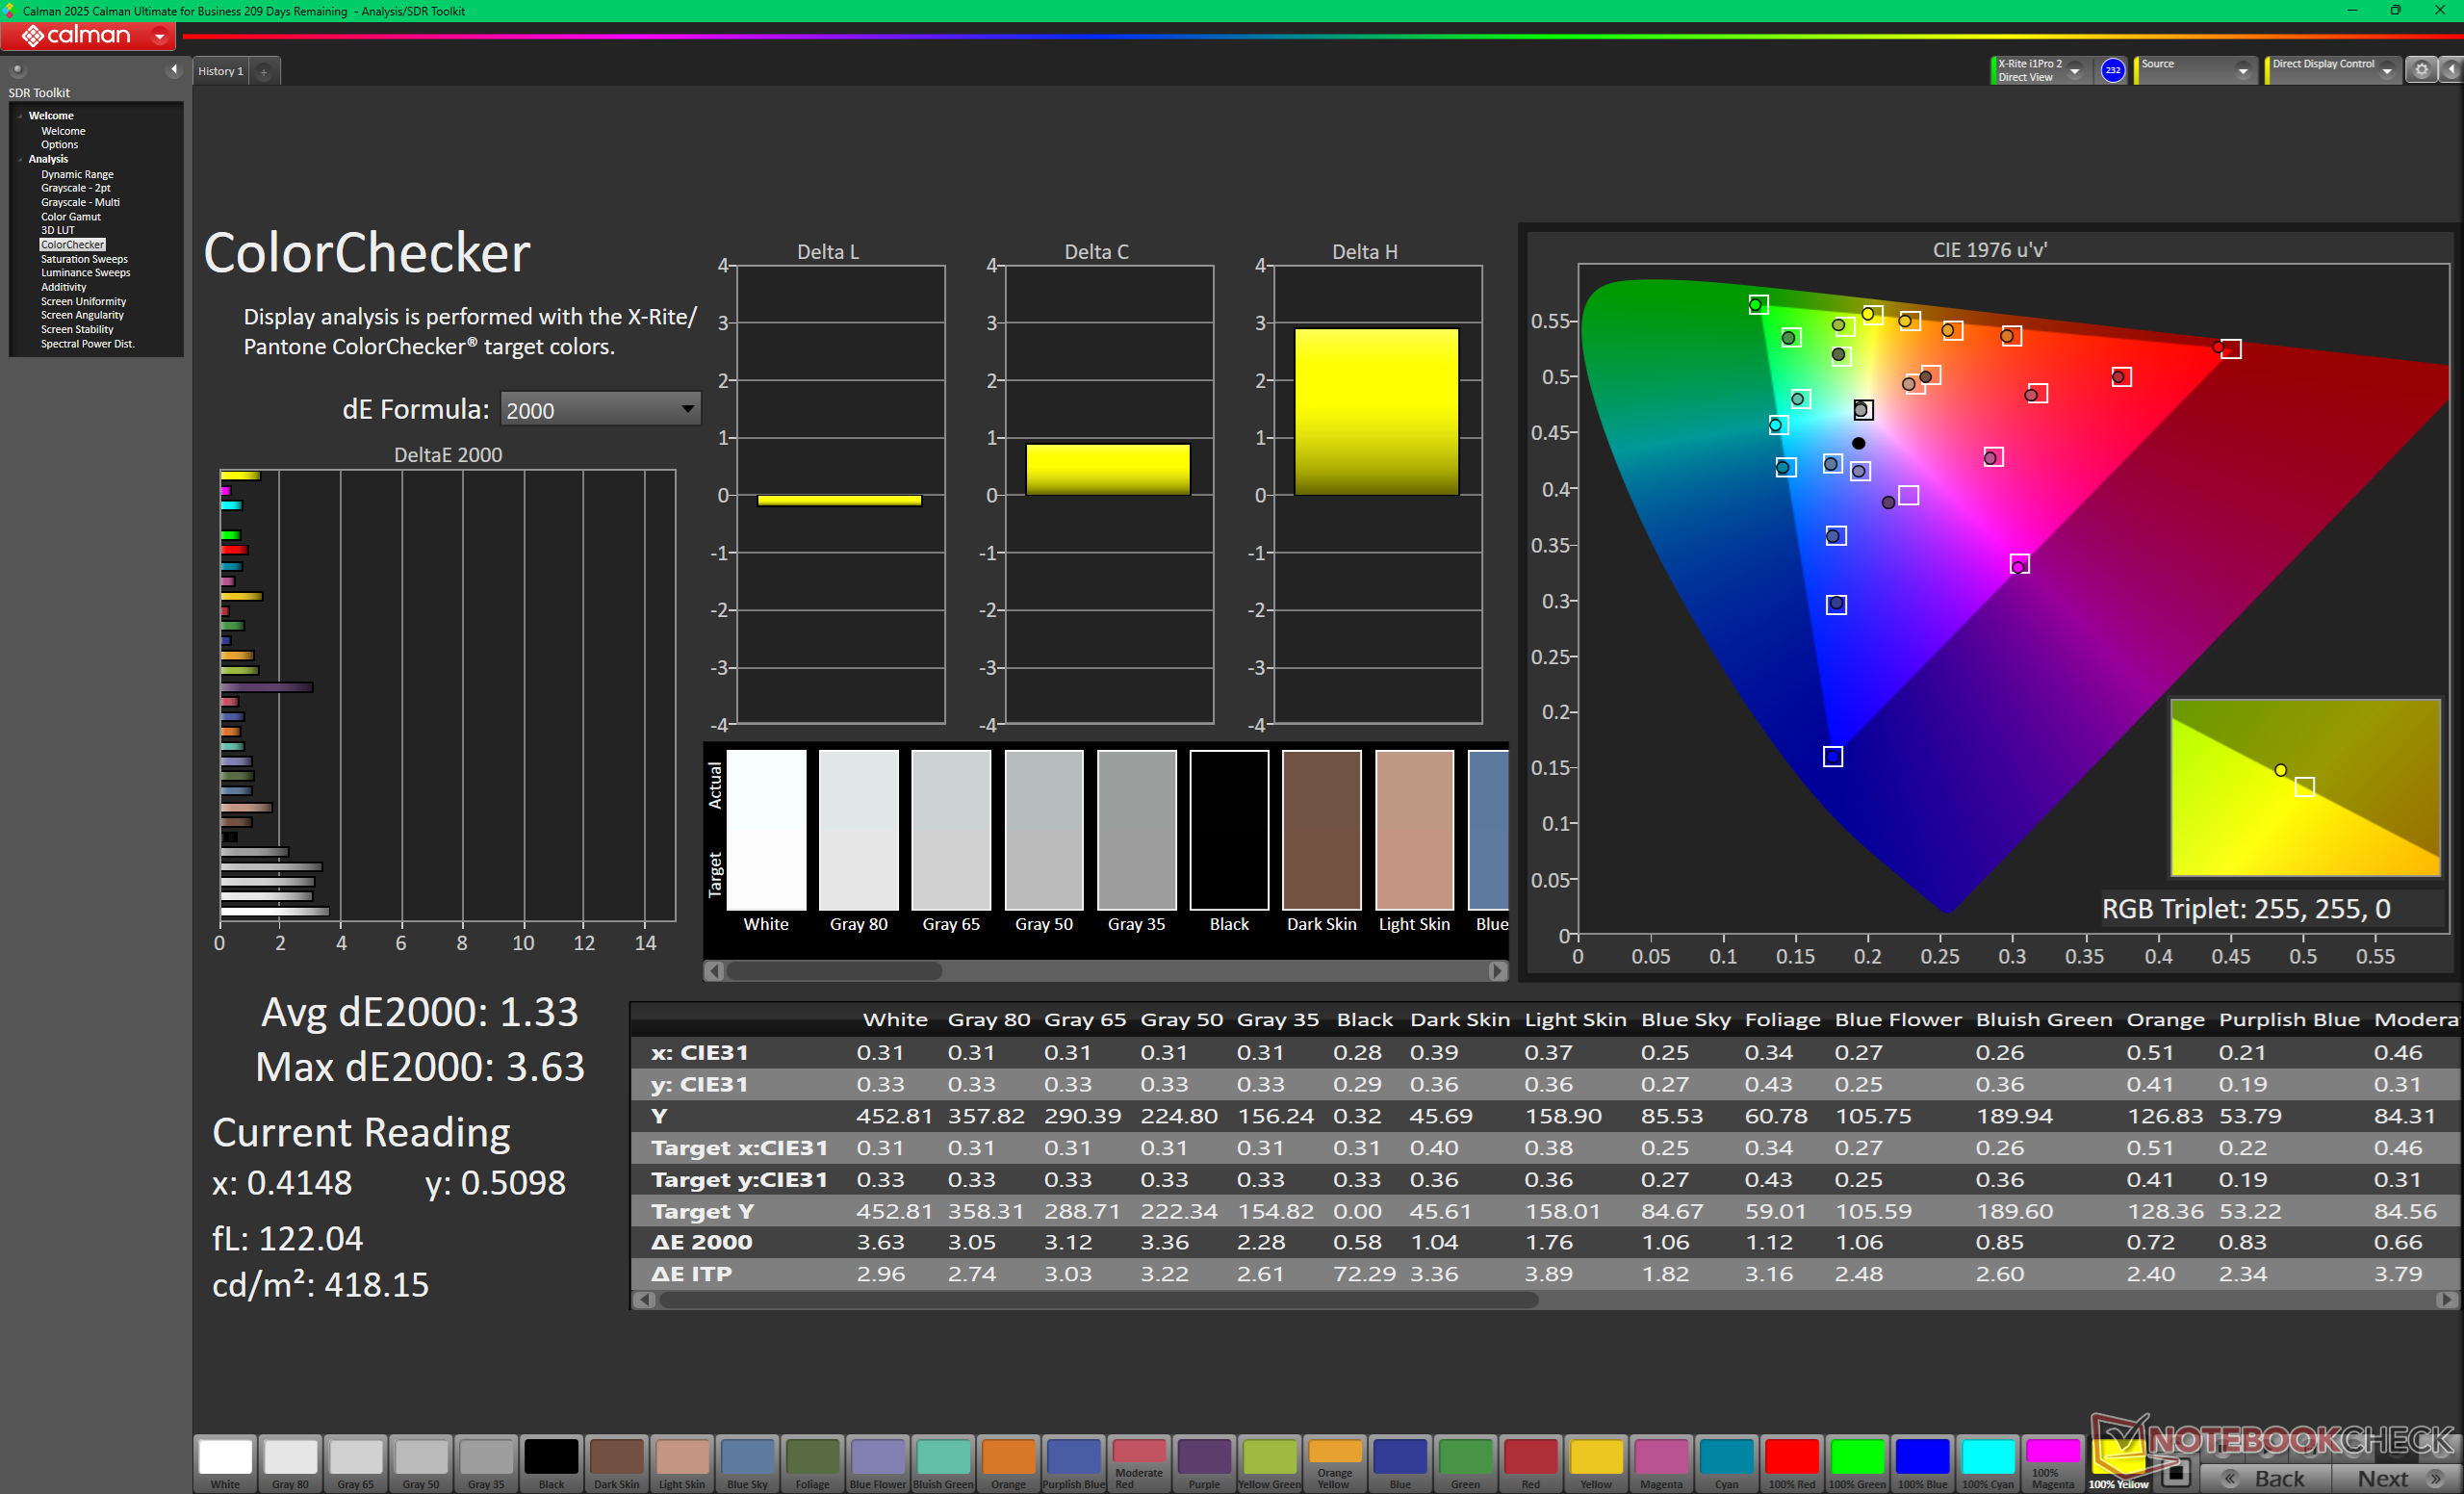
ΔE ColorChecker Calman: 2.23 | ∀{0.5-29.43 Ø4.72}
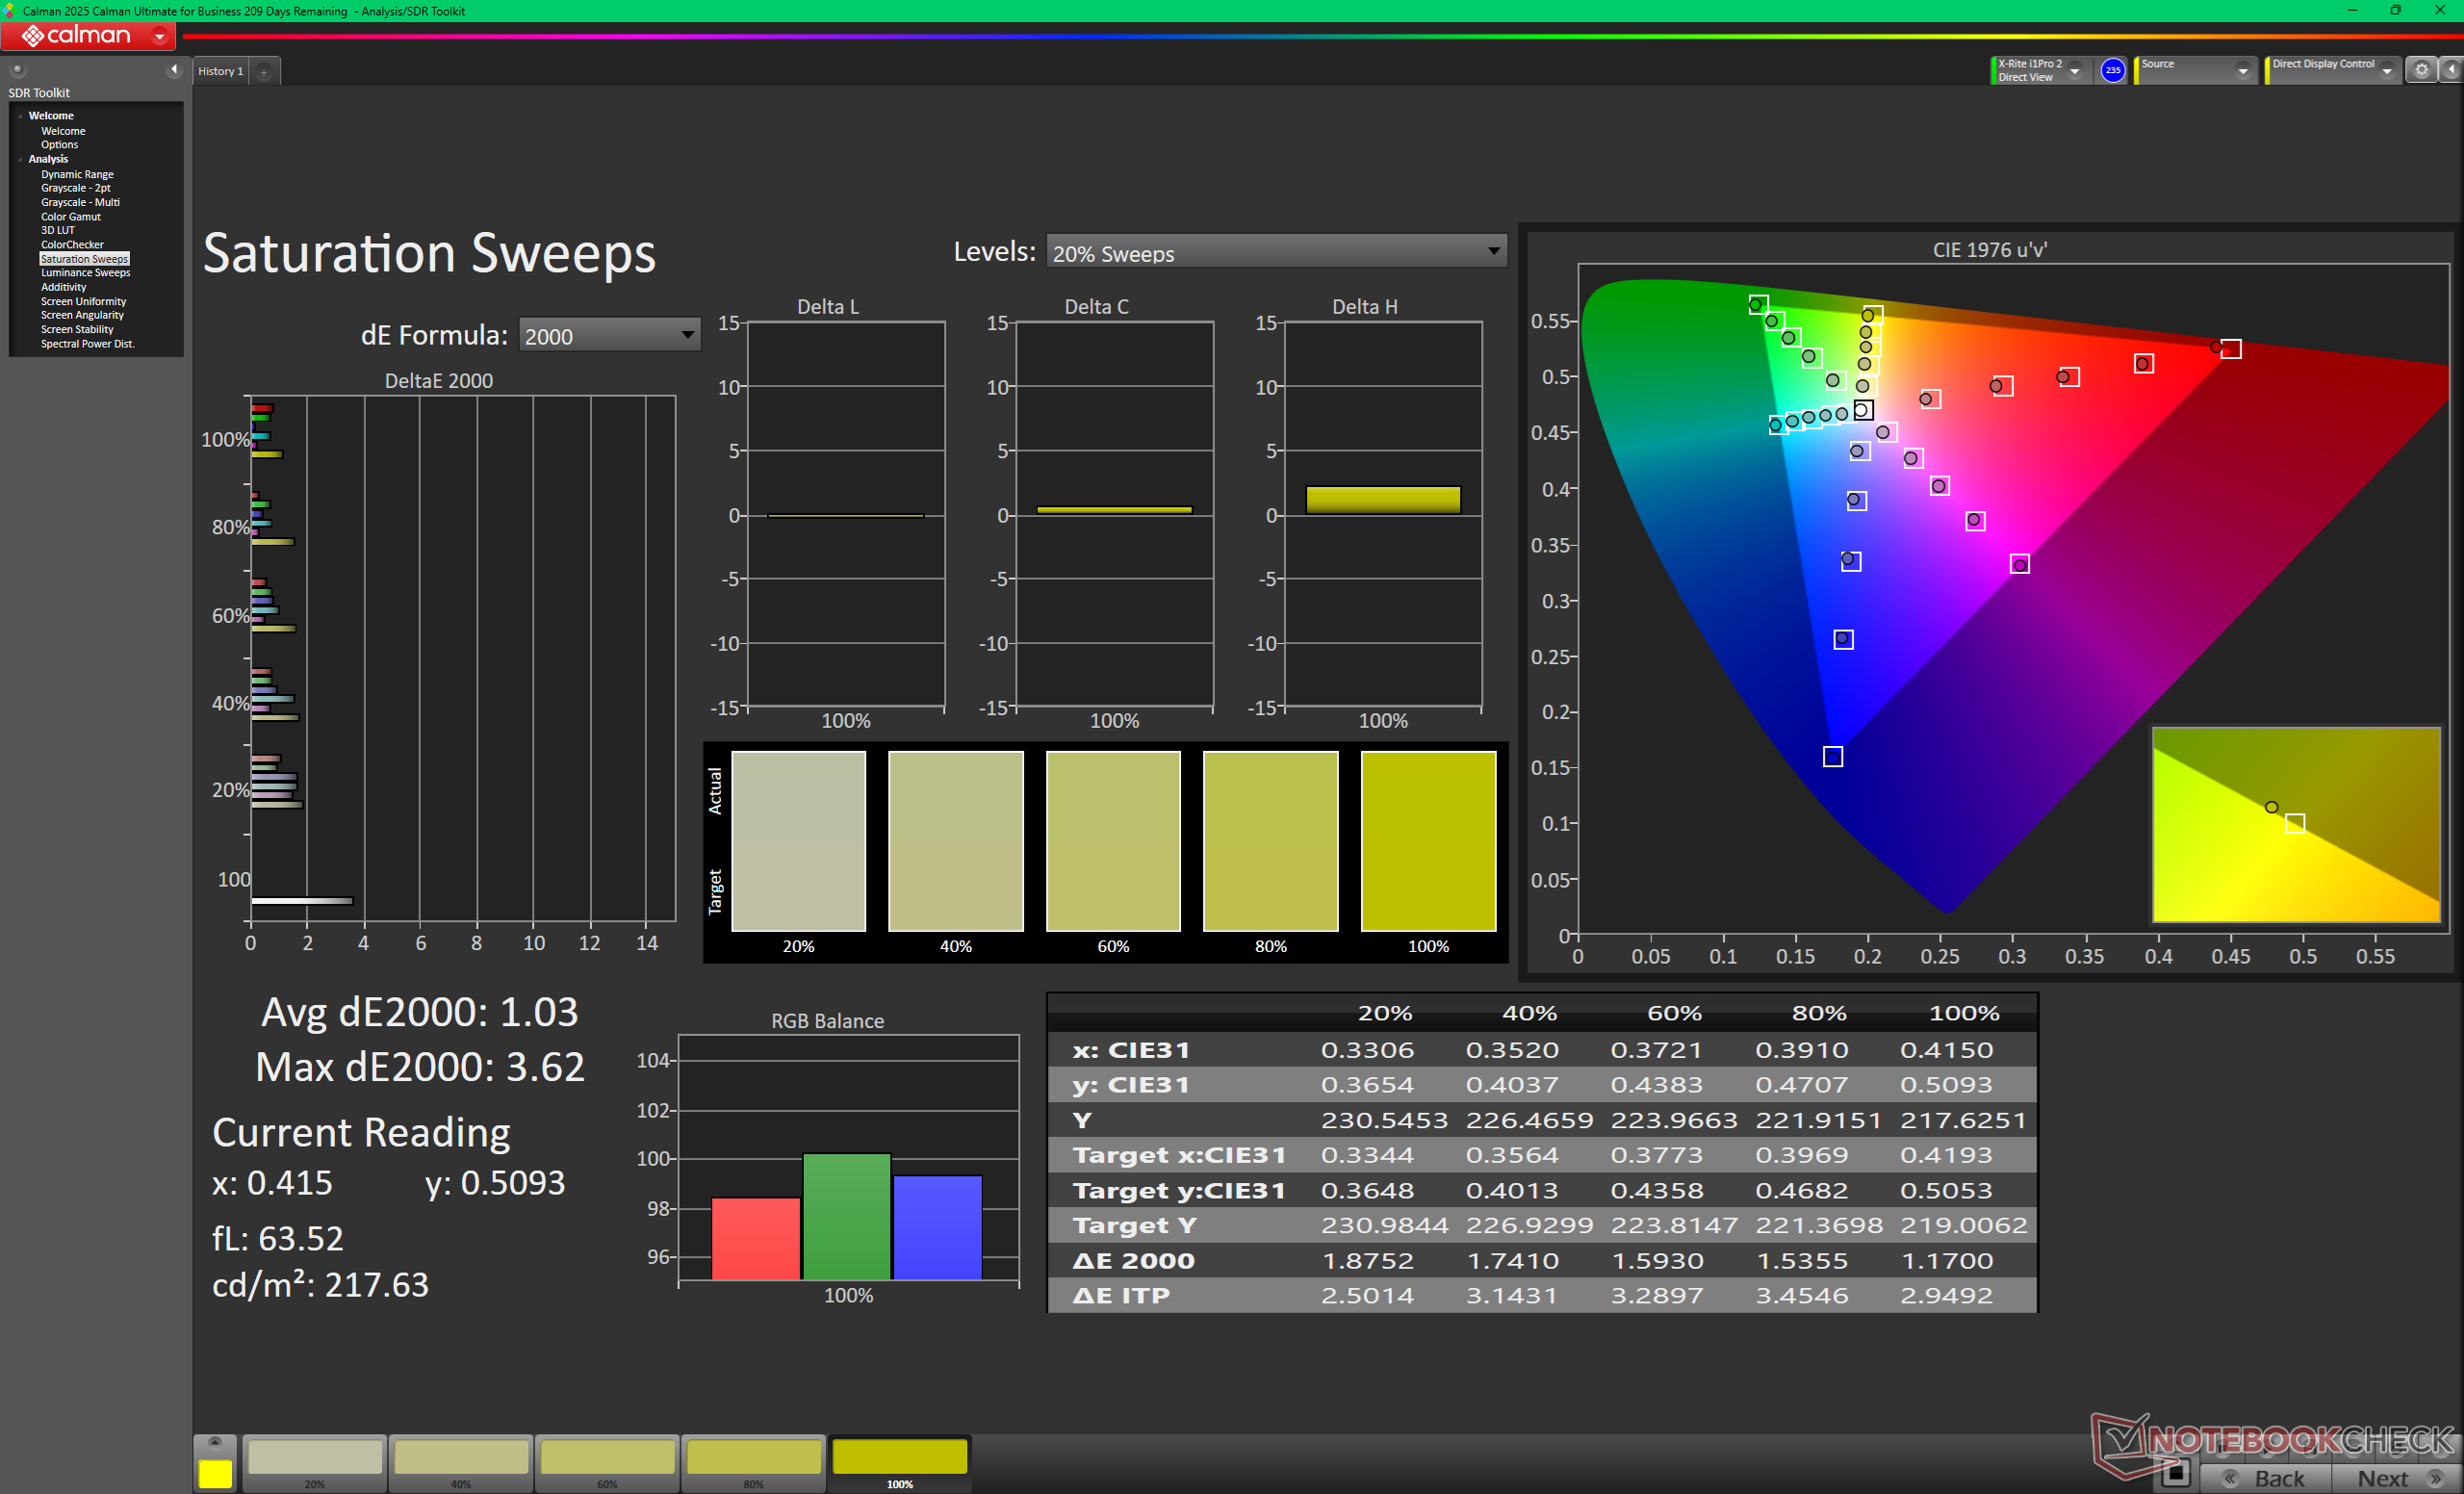
calibrated: 1.33
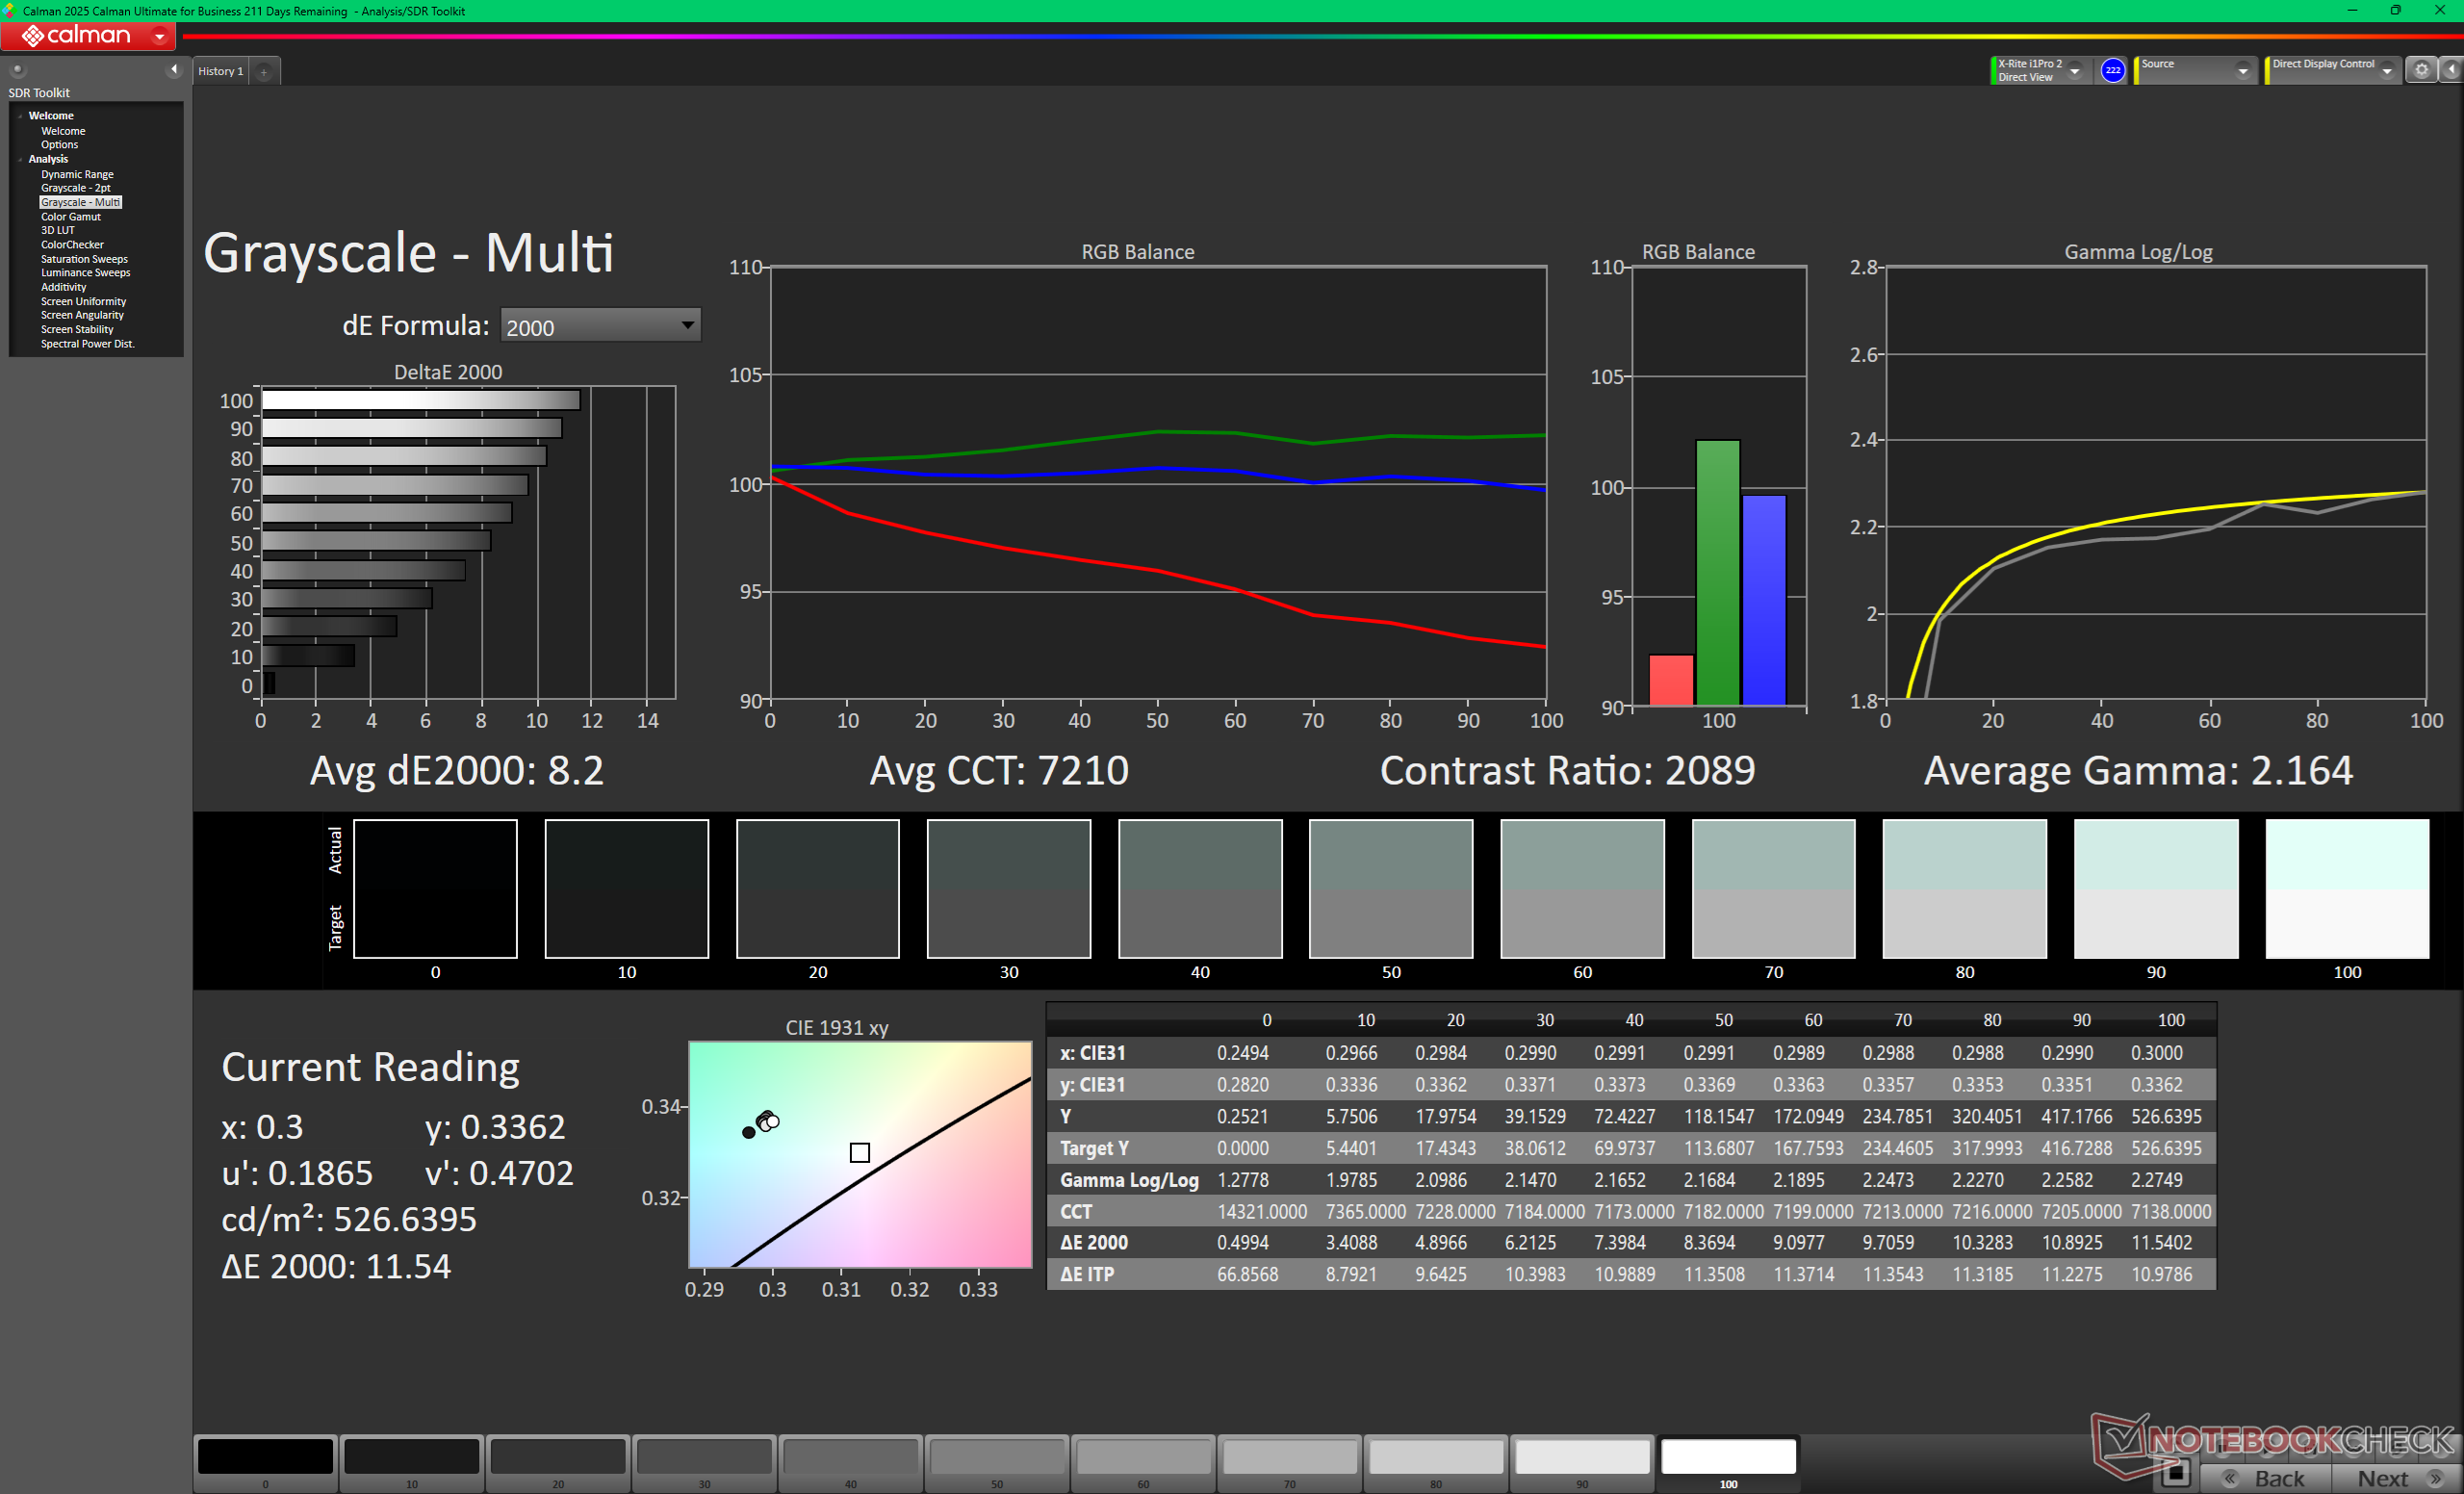
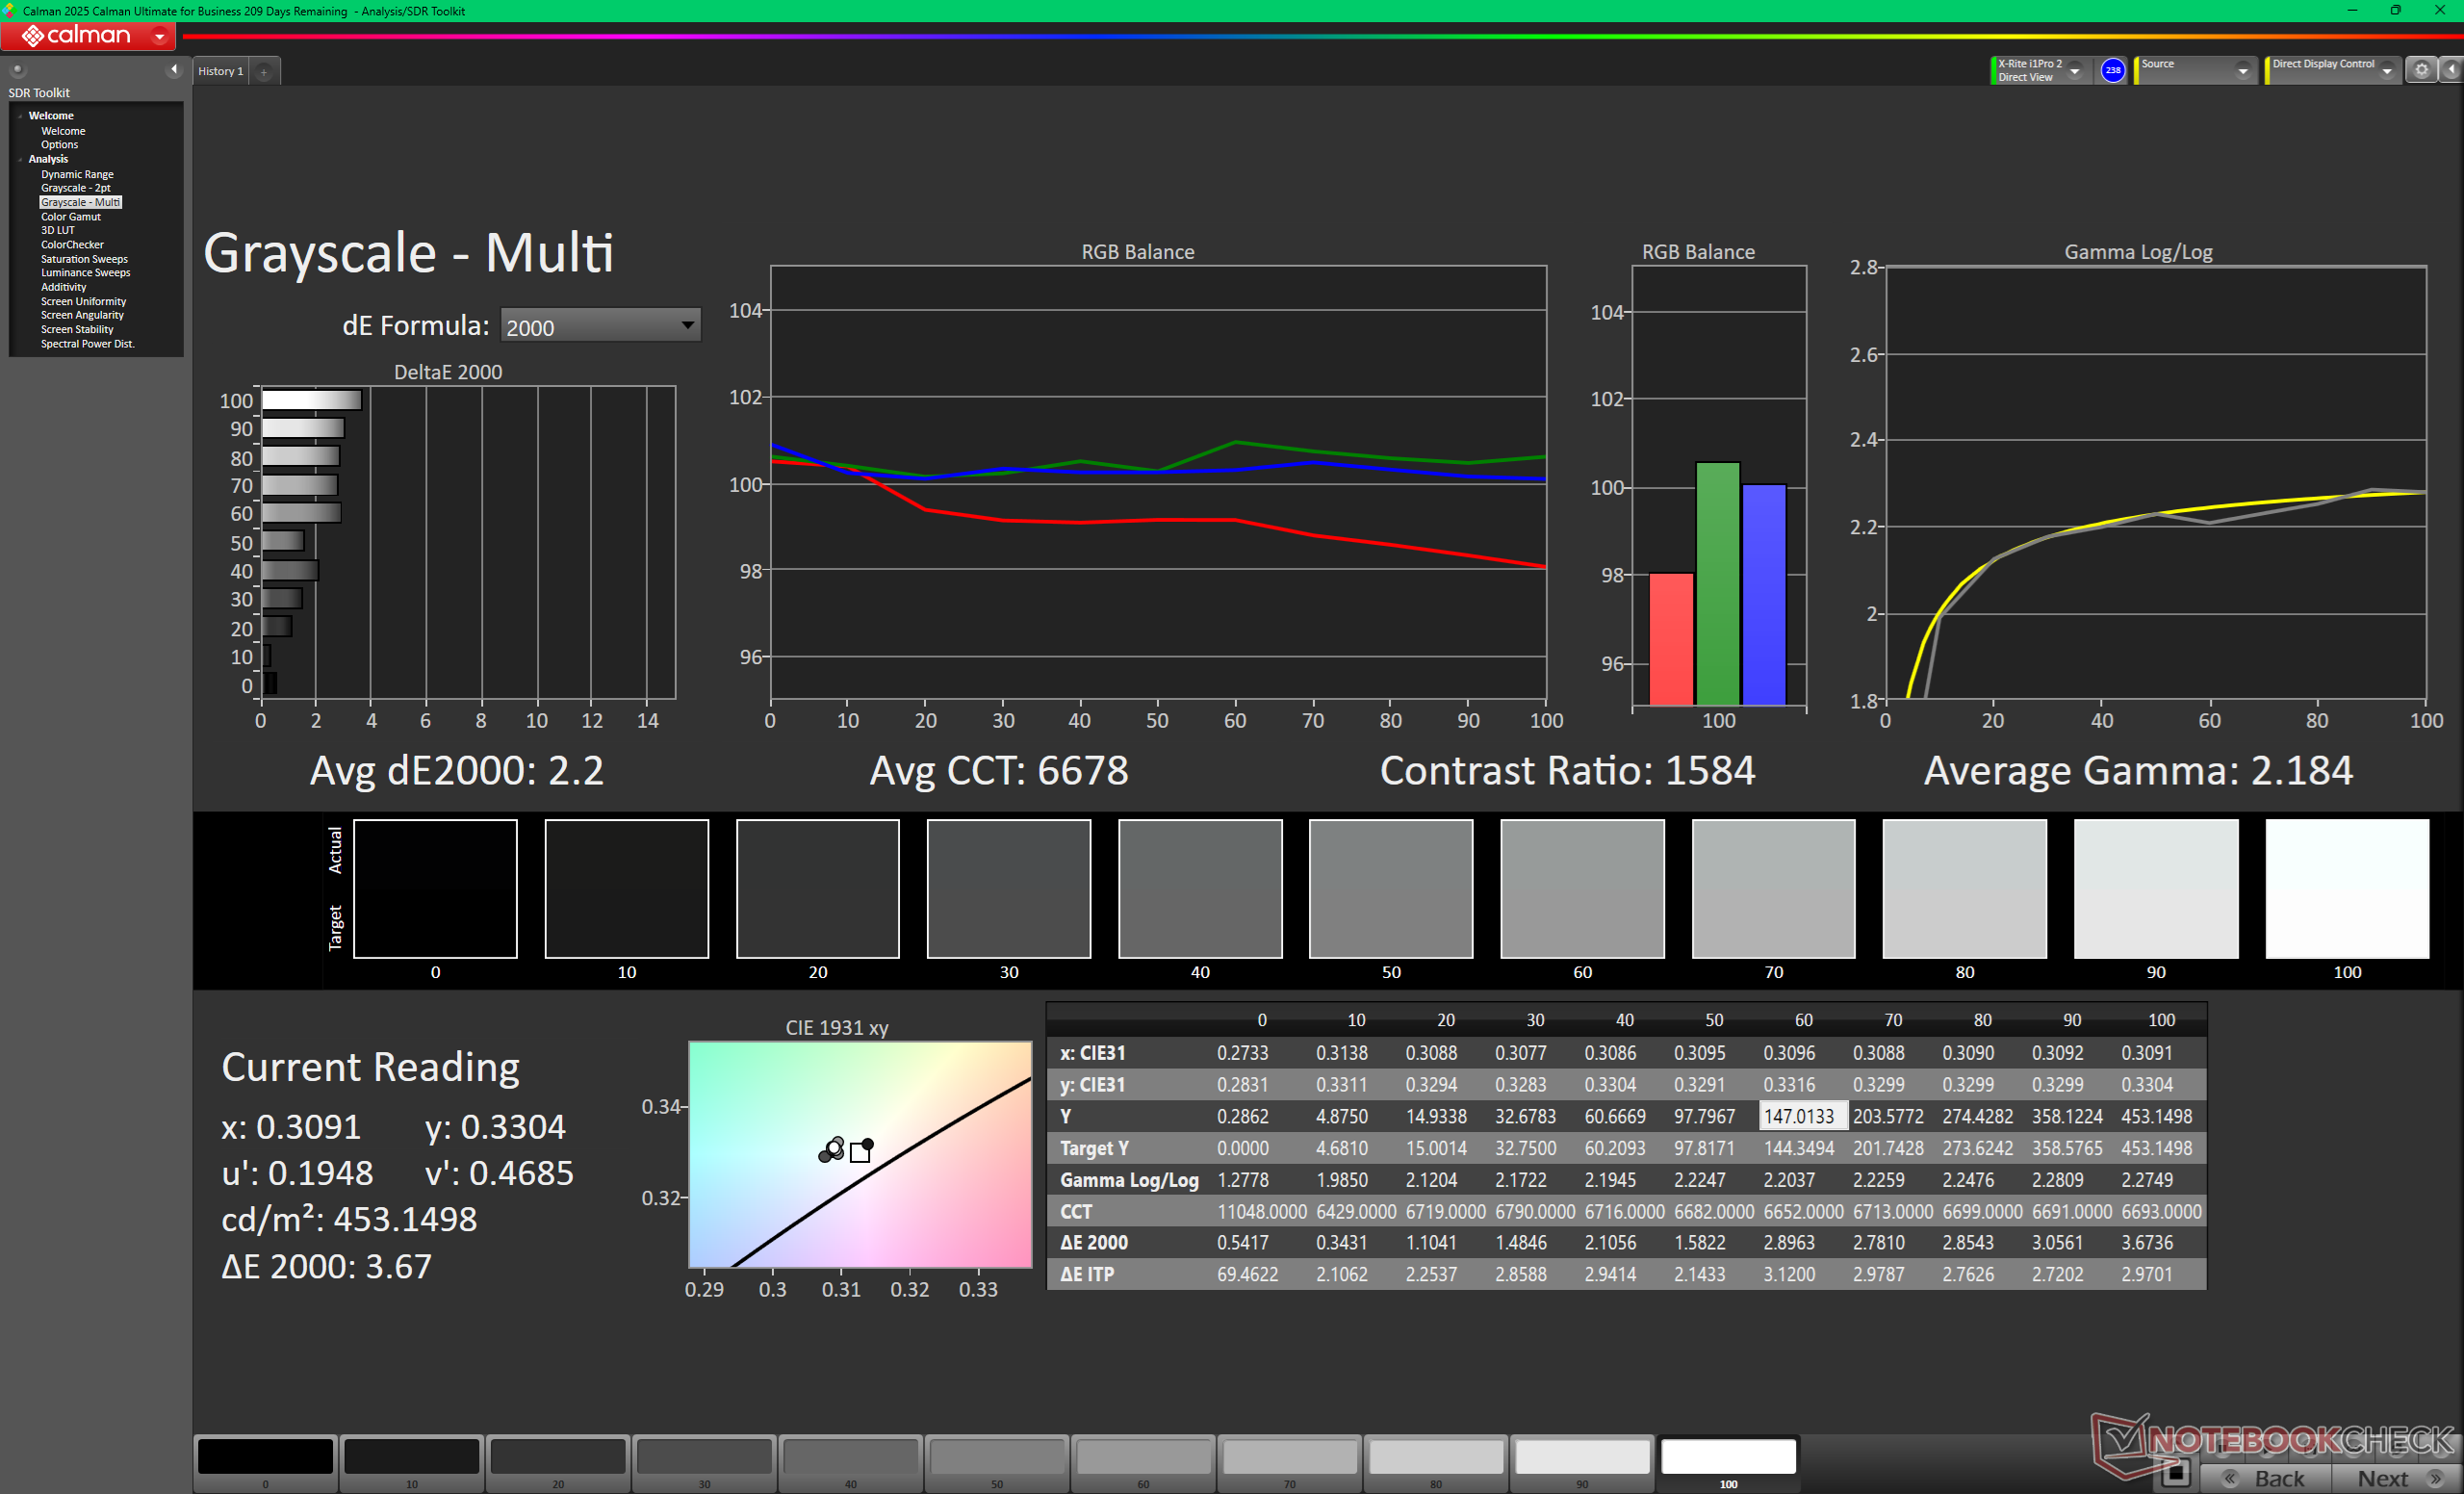
ΔE Greyscale Calman: 8.2 | ∀{0.09-98 Ø4.97}
71.3% AdobeRGB 1998 (Argyll 3D)
98.5% sRGB (Argyll 3D)
69.8% Display P3 (Argyll 3D)
Gamma: 2.16
CCT: 7210 K
| Lenovo ThinkPad X1 2-in-1 Gen 11 AUO B140UAN10.0, IPS, 1920×1200, 14″, 60 Hz | Lenovo ThinkPad X1 2-in-1 Gen 10 N140JLG-GT3, IPS, 1920×1200, 14″, 60 Hz | Lenovo Yoga Book 9 14IAH10 LEN140WQ+, 2x, OLED, 2880×1800, 14″, 120 Hz | HP EliteBook X Flip G1i 14 AI AUO8FB5, IPS, 1920×1200, 14″, 60 Hz | Dell Latitude 7450 2-in-1 BOE NV140WU, IPS, 1920×1200, 14″, 60 Hz | Asus ExpertBook Ultra B9406CAA Samsung ATNA40LE01-0, OLED, 2880×1800, 14″, 120 Hz | |
|---|---|---|---|---|---|---|
| Display | -2% | 25% | 7% | 6% | 21% | |
| Display P3 Coverage (%) | 69.8 | 67.8 -3% | 99.9 43% | 76.7 10% | 76.5 10% | 96.2 38% |
| sRGB Coverage (%) | 98.5 | 97.2 -1% | 100 2% | 98.2 0% | 100 2% | 100 2% |
| AdobeRGB 1998 Coverage (%) | 71.3 | 69.8 -2% | 92.2 29% | 78.2 10% | 76 7% | 86.7 22% |
| Response Times | -17% | 97% | -17% | 3% | 97% | |
| Response Time Grey 50% / Grey 80% * (ms) | 41.2 ? | 44.6 ? -8% | 0.6 ? 99% | 49.2 ? -19% | 35.65 ? 13% | 0.71 ? 98% |
| Response Time Black / White * (ms) | 21.6 ? | 27.1 ? -25% | 1 ? 95% | 24.8 ? -15% | 23.35 ? -8% | 0.94 ? 96% |
| PWM Frequency (Hz) | 480 ? | 968.8 ? | ||||
| PWM Amplitude * (%) | 43 | 20 | ||||
| Screen | -2% | 1% | -19% | -7% | 34% | |
| Brightness middle (cd/m²) | 527.7 | 459 -13% | 381.7 -28% | 572 8% | 333 -37% | 600.5 14% |
| Brightness (cd/m²) | 490 | 455 -7% | 398 -19% | 541 10% | 326 -33% | 612 25% |
| Brightness Distribution (%) | 86 | 89 3% | 94 9% | 78 -9% | 85 -1% | 96 12% |
| Black Level * (cd/m²) | 0.28 | 0.24 14% | 0.2 29% | 0.27 4% | ||
| Contrast (:1) | 1885 | 1913 1% | 2860 52% | 1233 -35% | ||
| Colorchecker dE 2000 * | 2.23 | 3.14 -41% | 2.93 -31% | 4.19 -88% | 2.46 -10% | 1.18 47% |
| Colorchecker dE 2000 max. * | 3.58 | 6.55 -83% | 5.93 -66% | 8.65 -142% | 4.58 -28% | 3.4 5% |
| Colorchecker dE 2000 calibrated * | 1.33 | 0.58 56% | 0.61 54% | 2.11 -59% | 1.31 2% | 0.73 45% |
| Greyscale dE 2000 * | 8.2 | 3.9 52% | 0.8 90% | 5.65 31% | 2.1 74% | 1 88% |
| Gamma | 2.16 102% | 2.16 102% | 2.16 102% | 2.45 90% | 2.2 100% | 2.27 97% |
| CCT | 7210 90% | 5867 111% | 6404 101% | 5959 109% | 6578 99% | 6567 99% |
| Total Average (Program / Settings) | -7% / -4% | 41% / 23% | -10% / -13% | 1% / -3% | 51% / 41% |
* … smaller is better
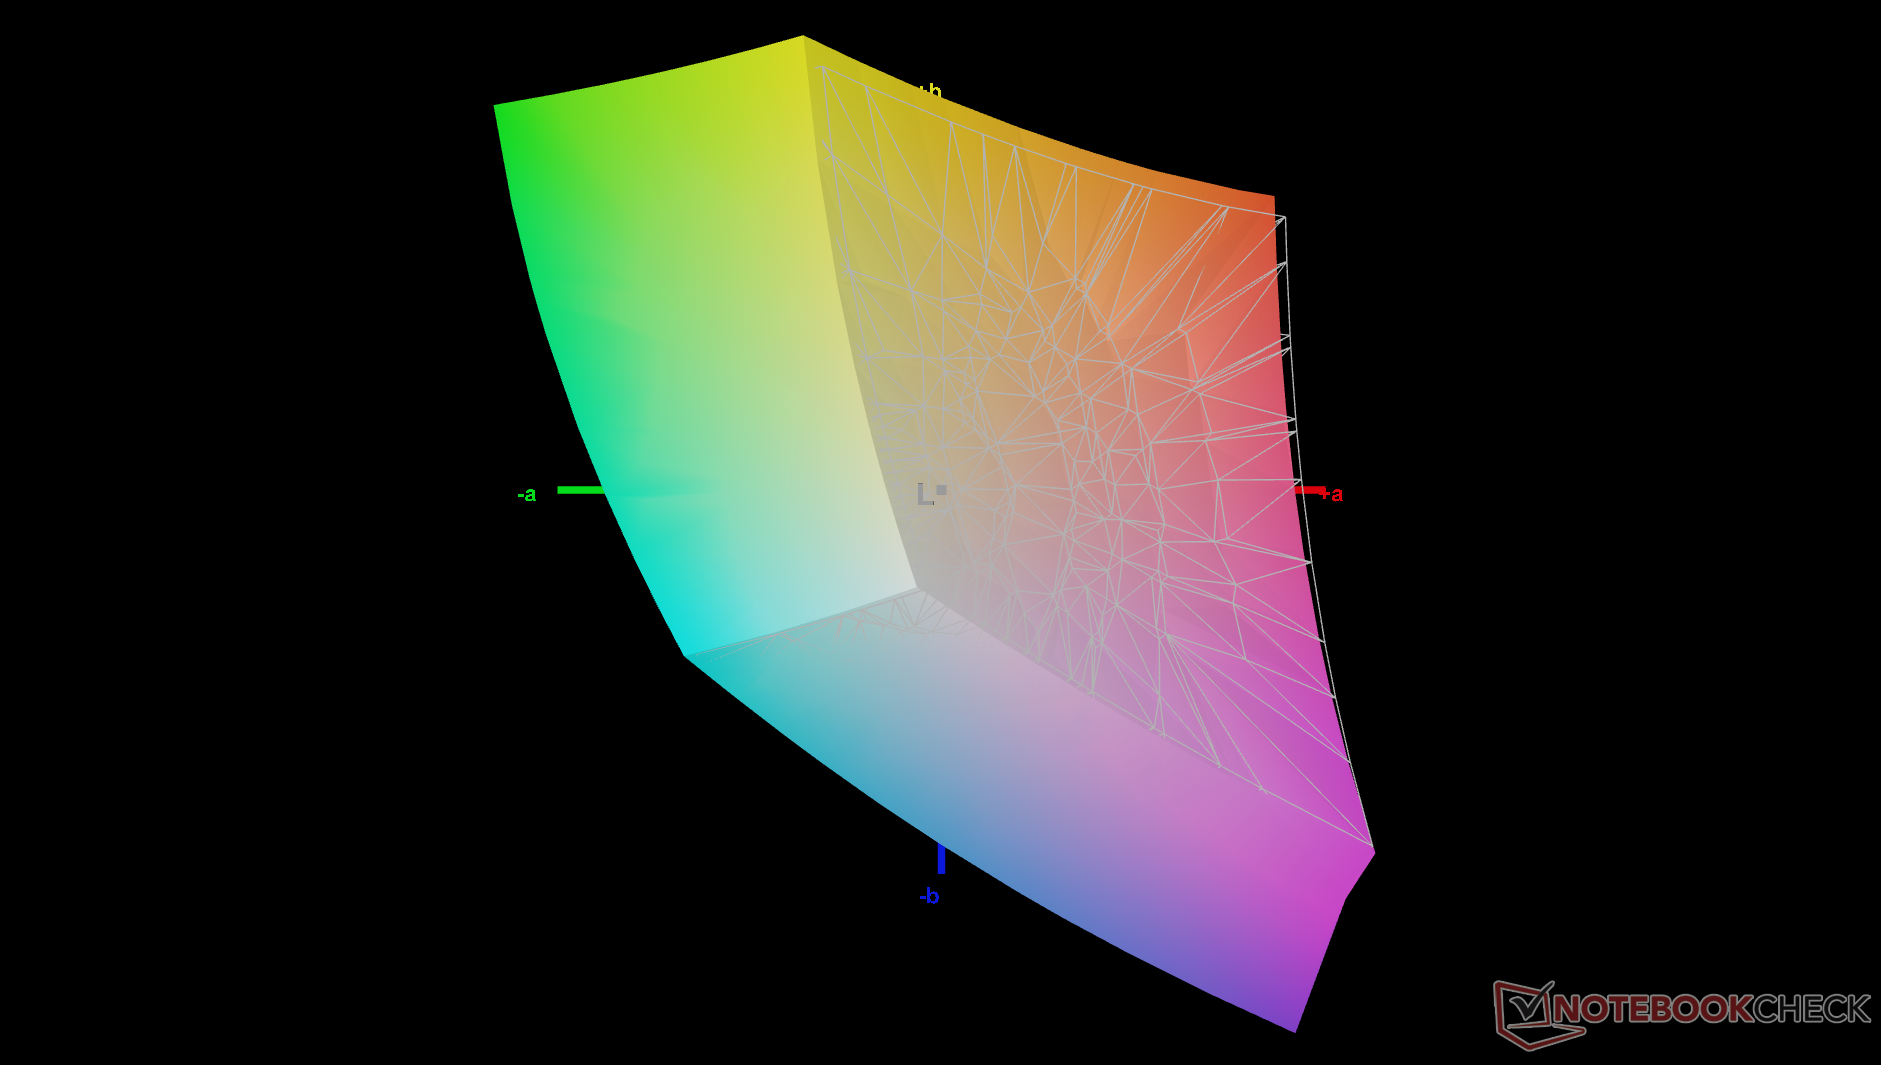
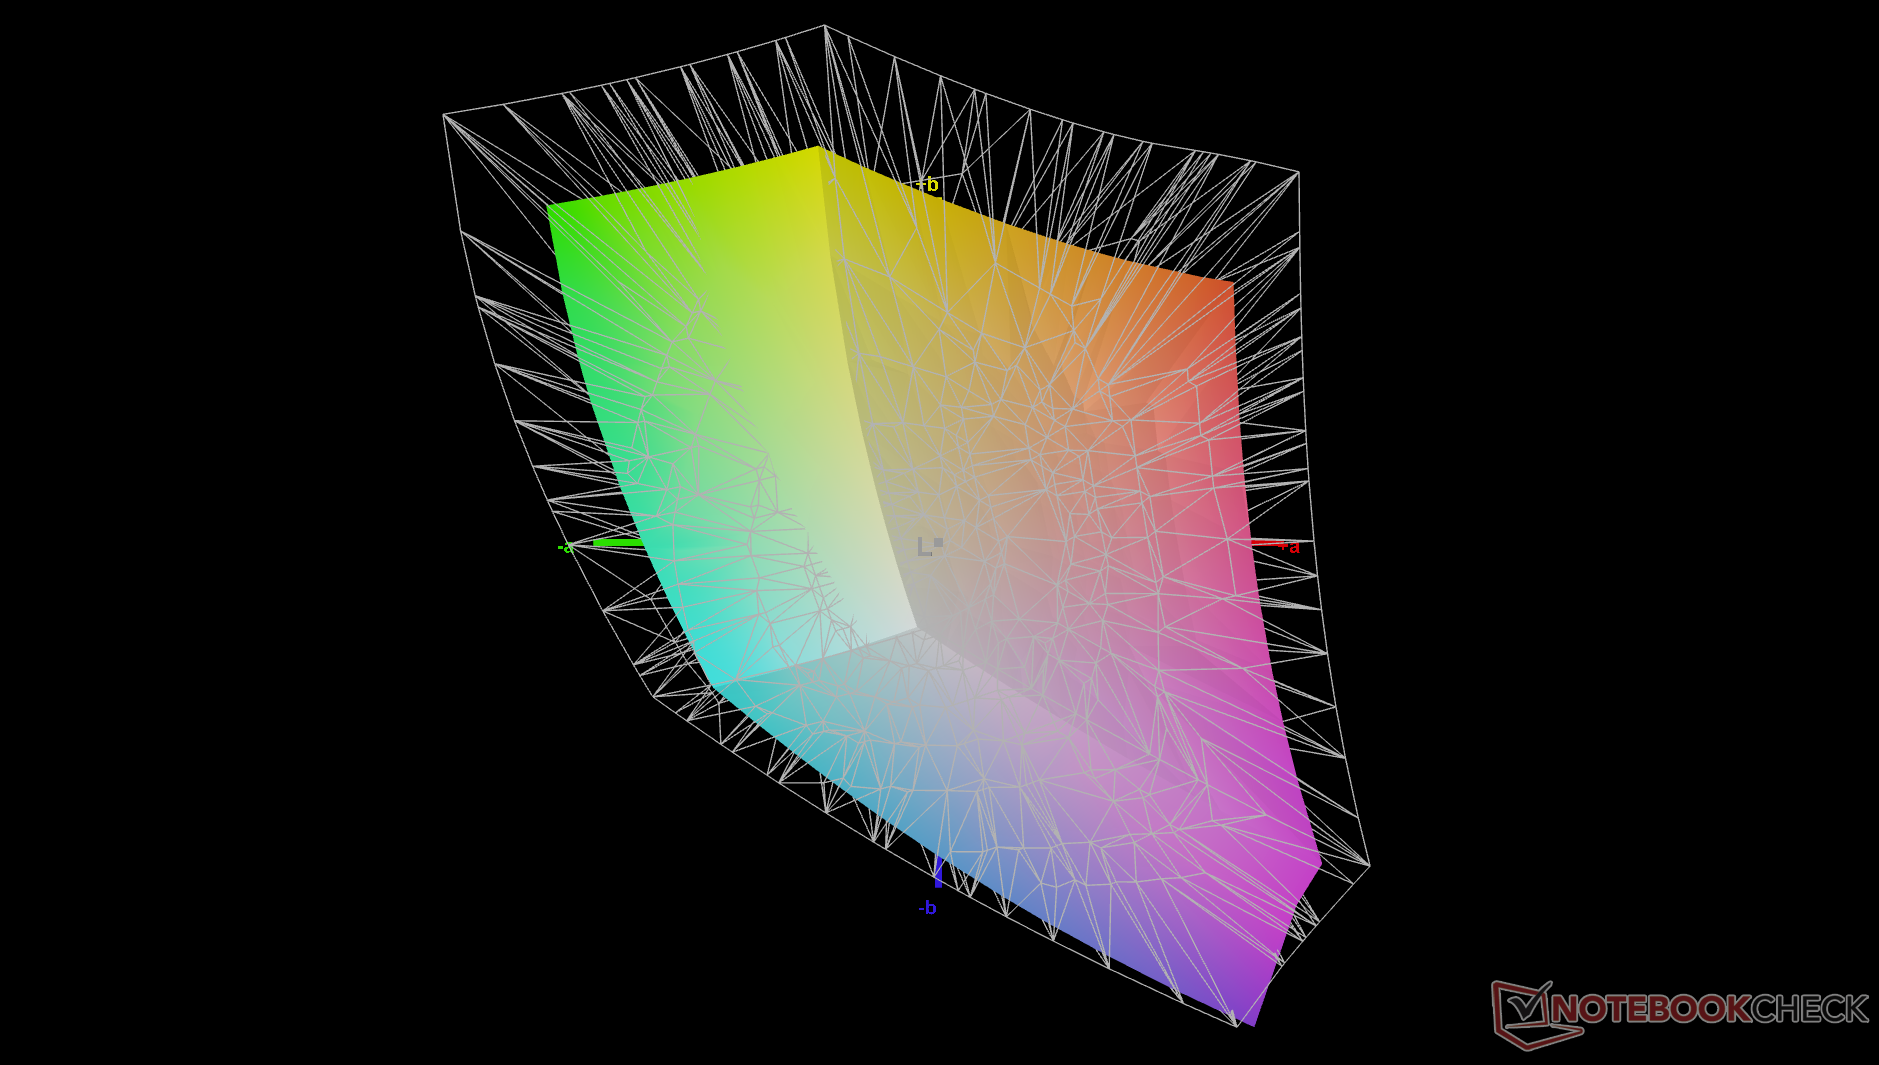
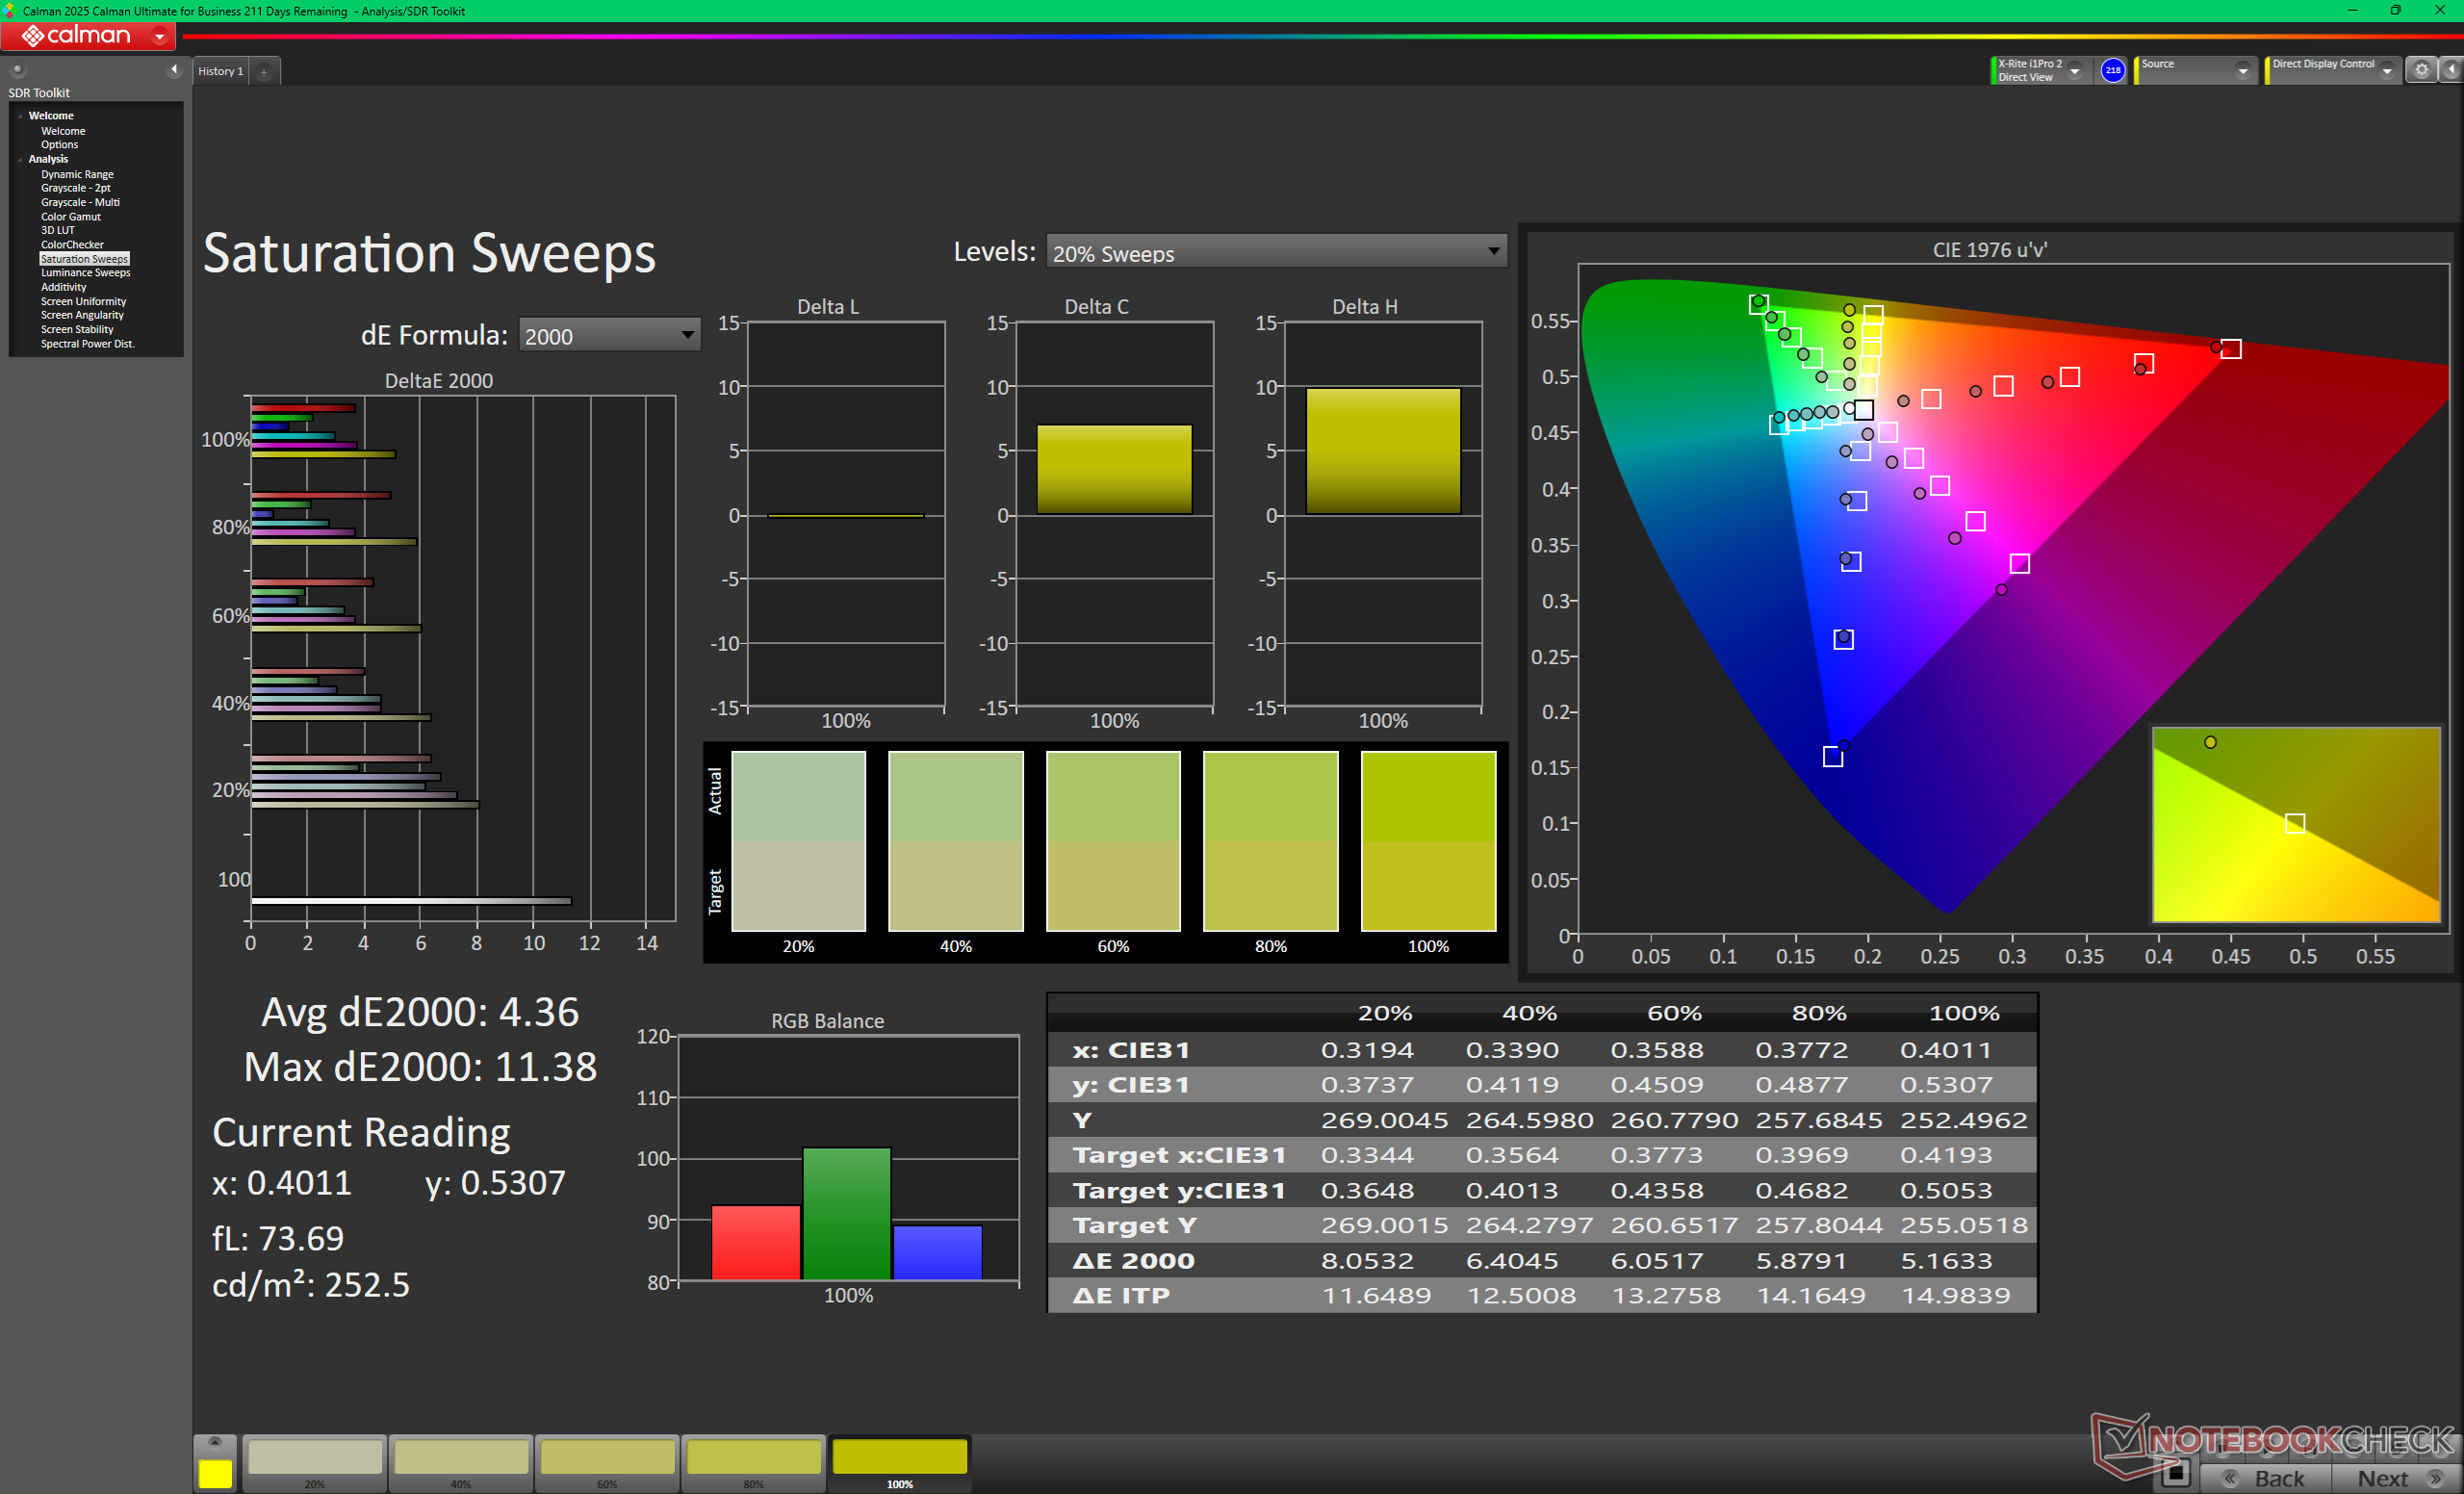
Color temperature is far too cool out of the box at 7200K. Calibrating the display with our X-Rite colorimeter would significantly improve average grayscale and color deltaE values from 8.2 and 2.23 to just 2.2 and 1.33, respectively.
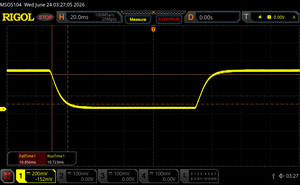
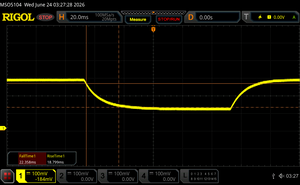
Display Response Times
ℹ
Display response times show how fast the screen is able to change from one color to the next. Slow response times can lead to afterimages and can cause moving objects to appear blurry (ghosting). Gamers of fast-paced 3D titles should pay special attention to fast response times.
Screen Flickering / PWM (Pulse-Width Modulation)
ℹ
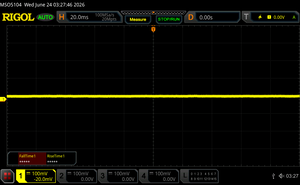
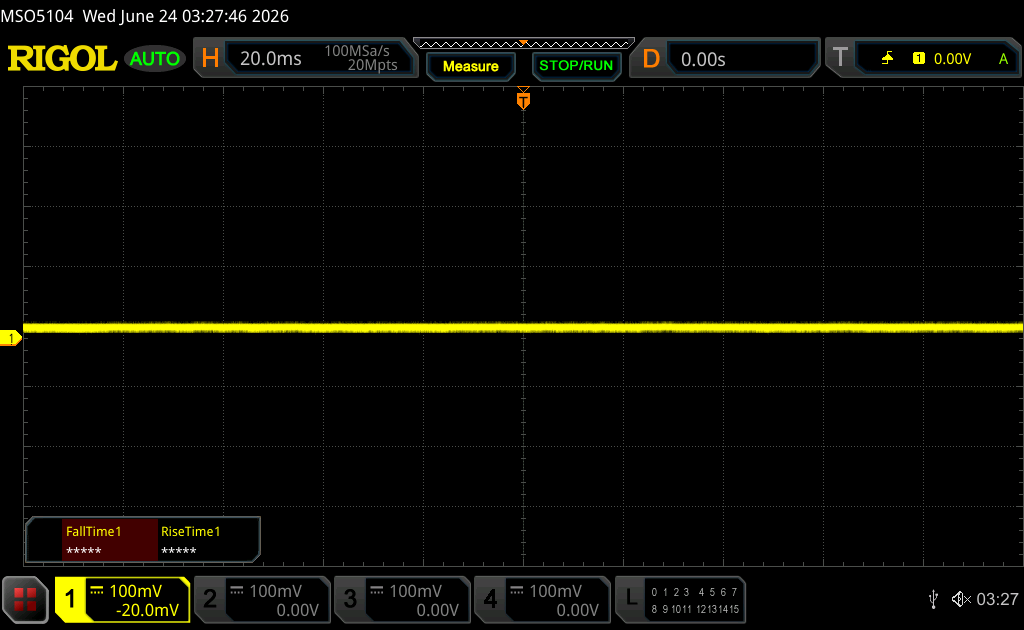
To dim the screen, some notebooks will simply cycle the backlight on and off in rapid succession – a method called Pulse Width Modulation (PWM) . This cycling frequency should ideally be undetectable to the human eye. If said frequency is too low, users with sensitive eyes may experience strain or headaches or even notice the flickering altogether.



Performance
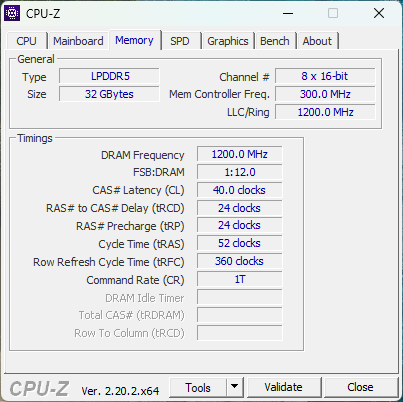
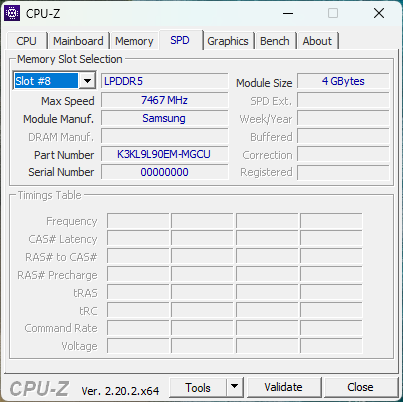
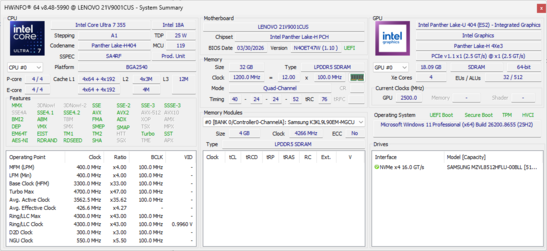
Testing Conditions
We set Windows to Performance mode prior to running the benchmarks below.
Processor Performance
The Core Ultra 7 355 is roughly 10 to 15 percent faster and with steadier performance than the Core Ultra 7 258V in last year’s model. Upgrading to the top-end Core Ultra X7 368H configuration can boost multi-thread performance by as much as 70 percent. NPU performance, however, remains nearly the same across all current SKUs of the ThinkPad X1 2-in-1 Gen 11.
Cinebench R15 Multi Loop
0651301952603253904555205856507157808459109751040110511701235130013651430149515601625169017551820188519502015208021452210227523402405247025352600266527302795286029252990
Lenovo ThinkPad X1 2-in-1 Gen 11 Intel Core Ultra 7 355: Ø1689 (1656.45-1706.27) Points
Lenovo ThinkPad X1 2-in-1 Gen 10 Intel Core Ultra 7 258V: Ø1232 (1141.62-1584.53) Points
Lenovo Yoga Book 9 14IAH10 Intel Core Ultra 7 255H: Ø2165 (2075.66-2834.87) Points
HP EliteBook X Flip G1i 14 AI Intel Core Ultra 7 258V: Ø1351 (1333.02-1503.76) Points
Dell Latitude 7450 2-in-1 Intel Core Ultra 7 165U: Ø1385 (1049.21-1643.86) Points
Asus ExpertBook Ultra B9406CAA Intel Core Ultra X7 358H: Ø2886 (2802.49-3038.82) Points
CPU Performance rating: Percent
Cinebench R23: Multi Core | Single Core
Cinebench R20: CPU (Multi Core) | CPU (Single Core)
Cinebench R15: CPU Multi 64Bit | CPU Single 64Bit
Blender: v2.79 BMW27 CPU
7-Zip 18.03: 7z b 4 | 7z b 4 -mmt1
Geekbench 6.7: Multi-Core | Single-Core
Geekbench 5.5: Multi-Core | Single-Core
HWBOT x265 Benchmark v2.2: 4k Preset
LibreOffice : 20 Documents To PDF
R Benchmark 2.5: Overall mean
| CPU Performance rating | |
| Asus ExpertBook Ultra B9406CAA Intel Core Ultra X7 358H | 85.2 pt+25% |
| HP OmniBook Ultra 14 Core Ultra X9 Intel Core Ultra X9 388H | 84.1 pt+23% |
| Lenovo Yoga Book 9 14IAH10 Intel Core Ultra 7 255H | 81.1 pt+19% |
| Average Intel Core Ultra 7 355 | 64.1 pt-6% |
| Lenovo ThinkPad X1 2-in-1 Gen 11 Intel Core Ultra 7 355 | 64 pt-6% |
| Lenovo ThinkPad X1 2-in-1 Gen 10 Intel Core Ultra 7 258V | 60.6 pt-11% |
| Lenovo ThinkPad T14 Gen 7 21WN00A0GE Intel Core Ultra 5 325 | 59.2 pt-13% |
| Lenovo ThinkPad X1 Carbon Gen 13 21NX008PGE Intel Core Ultra 5 225U | 58.7 pt-14% |
| Lenovo Yoga Slim 7a 14AGP11 AMD Ryzen AI 7 445 | 56.2 pt-18% |
| HP EliteBook X Flip G1i 14 AI Intel Core Ultra 7 258V | 55.3 pt-19% |
| Dell Latitude 7450 2-in-1 Intel Core Ultra 7 165U | 55.3 pt-19% |
| Lenovo IdeaPad 5i 2-in-1 14IPH11 Intel Core Ultra 5 322 | 50.1 pt-27% |
* … smaller is better
Cinebench R15 CPU Multi 64Bit
1706 Points
Cinebench R15 OpenGL 64Bit
176.8 fps
Cinebench R15 Ref. Match 64Bit
97.8 %
Cinebench R15 CPU Single 64Bit
289 Points
Cinebench R20 CPU (Multi Core)
4381 Points
Cinebench R20 CPU (Single Core)
742 Points
Cinebench R23 Single Core
1973 Points
Cinebench R23 Multi Core
11504 Points
Cinebench 2024 CPU Single Core
117.7 Points
Cinebench 2024 CPU Multi Core
677 Points
Cinebench 2026 CPU Multi
2749 Points
Cinebench 2026 CPU Single Thread
475 Points
Help
Performance rating: Percent
AIDA64: FP32 Ray-Trace | FPU Julia | CPU SHA3 | CPU Queen | FPU SinJulia | FPU Mandel | CPU AES | CPU ZLib | FP64 Ray-Trace | CPU PhotoWorxx | CPU CheckMate
| Performance rating | |
| Lenovo Yoga Book 9 14IAH10 -1! Intel Core Ultra 7 255H, Arc 140T | 95.6 pt+40% |
| Lenovo ThinkPad X1 2-in-1 Gen 11 -1! Intel Core Ultra 7 355, Intel Graphics 4 Xe3 PTL | 78.7 pt+15% |
| Average Intel Core Ultra 7 355 | 75.3 pt+10% |
| Lenovo ThinkPad X1 2-in-1 Gen 10 -1! Intel Core Ultra 7 258V, Arc 140V | 70.9 pt+4% |
| HP EliteBook X Flip G1i 14 AI -1! Intel Core Ultra 7 258V, Arc 140V | 68.4 pt0% |
| Dell Latitude 7450 2-in-1 -1! Intel Core Ultra 7 165U, Graphics 4-Core iGPU (Arrow Lake) | 67.9 pt-1% |
| Asus ExpertBook Ultra B9406CAA -1! Intel Core Ultra X7 358H, Arc B390 Panther Lake iGPU | 65.8 pt-4% |
System Performance
Performance rating: Percent
PCMark 10: Score | Essentials | Productivity | Digital Content Creation
CrossMark: Overall | Productivity | Creativity | Responsiveness
WebXPRT 3: Overall
WebXPRT 4: Overall
Mozilla Kraken 1.1: Total
Geekbench AI: Quantized GPU 1.7 | Half Precision GPU 1.7 | Single Precision GPU 1.7
| Performance rating | |
| Asus ExpertBook Ultra B9406CAA Arc B390 Panther Lake iGPU, Ultra X7 358H, Samsung PM9E1 MZVLC2T0HBLD | 89.5 pt+31% |
| Lenovo Yoga Book 9 14IAH10 Arc 140T, Ultra 7 255H, Samsung PM9C1a MZAL81T0HDLB | 76.3 pt+12% |
| Lenovo ThinkPad X1 2-in-1 Gen 11 Intel Graphics 4 Xe3 PTL, Ultra 7 355, Samsung PM9C1b MZVL8512HFLU-00BLL | 74.2 pt+8% |
| Dell Latitude 7450 2-in-1 -3! Graphics 4-Core iGPU (Arrow Lake), Ultra 7 165U, Micron 2550 512GB | 73.8 pt+8% |
| Average Intel Core Ultra 7 355, Intel Graphics 4 Xe3 Panther Lake iGPU | 73.8 pt+8% |
| Lenovo ThinkPad X1 2-in-1 Gen 10 -1! Arc 140V, Core Ultra 7 258V | 71 pt+4% |
| HP EliteBook X Flip G1i 14 AI -3! Arc 140V, Core Ultra 7 258V, Western Digital PC SN5000S SDEPNSJ-1T00-1006 | 67.3 pt-2% |
* … smaller is better
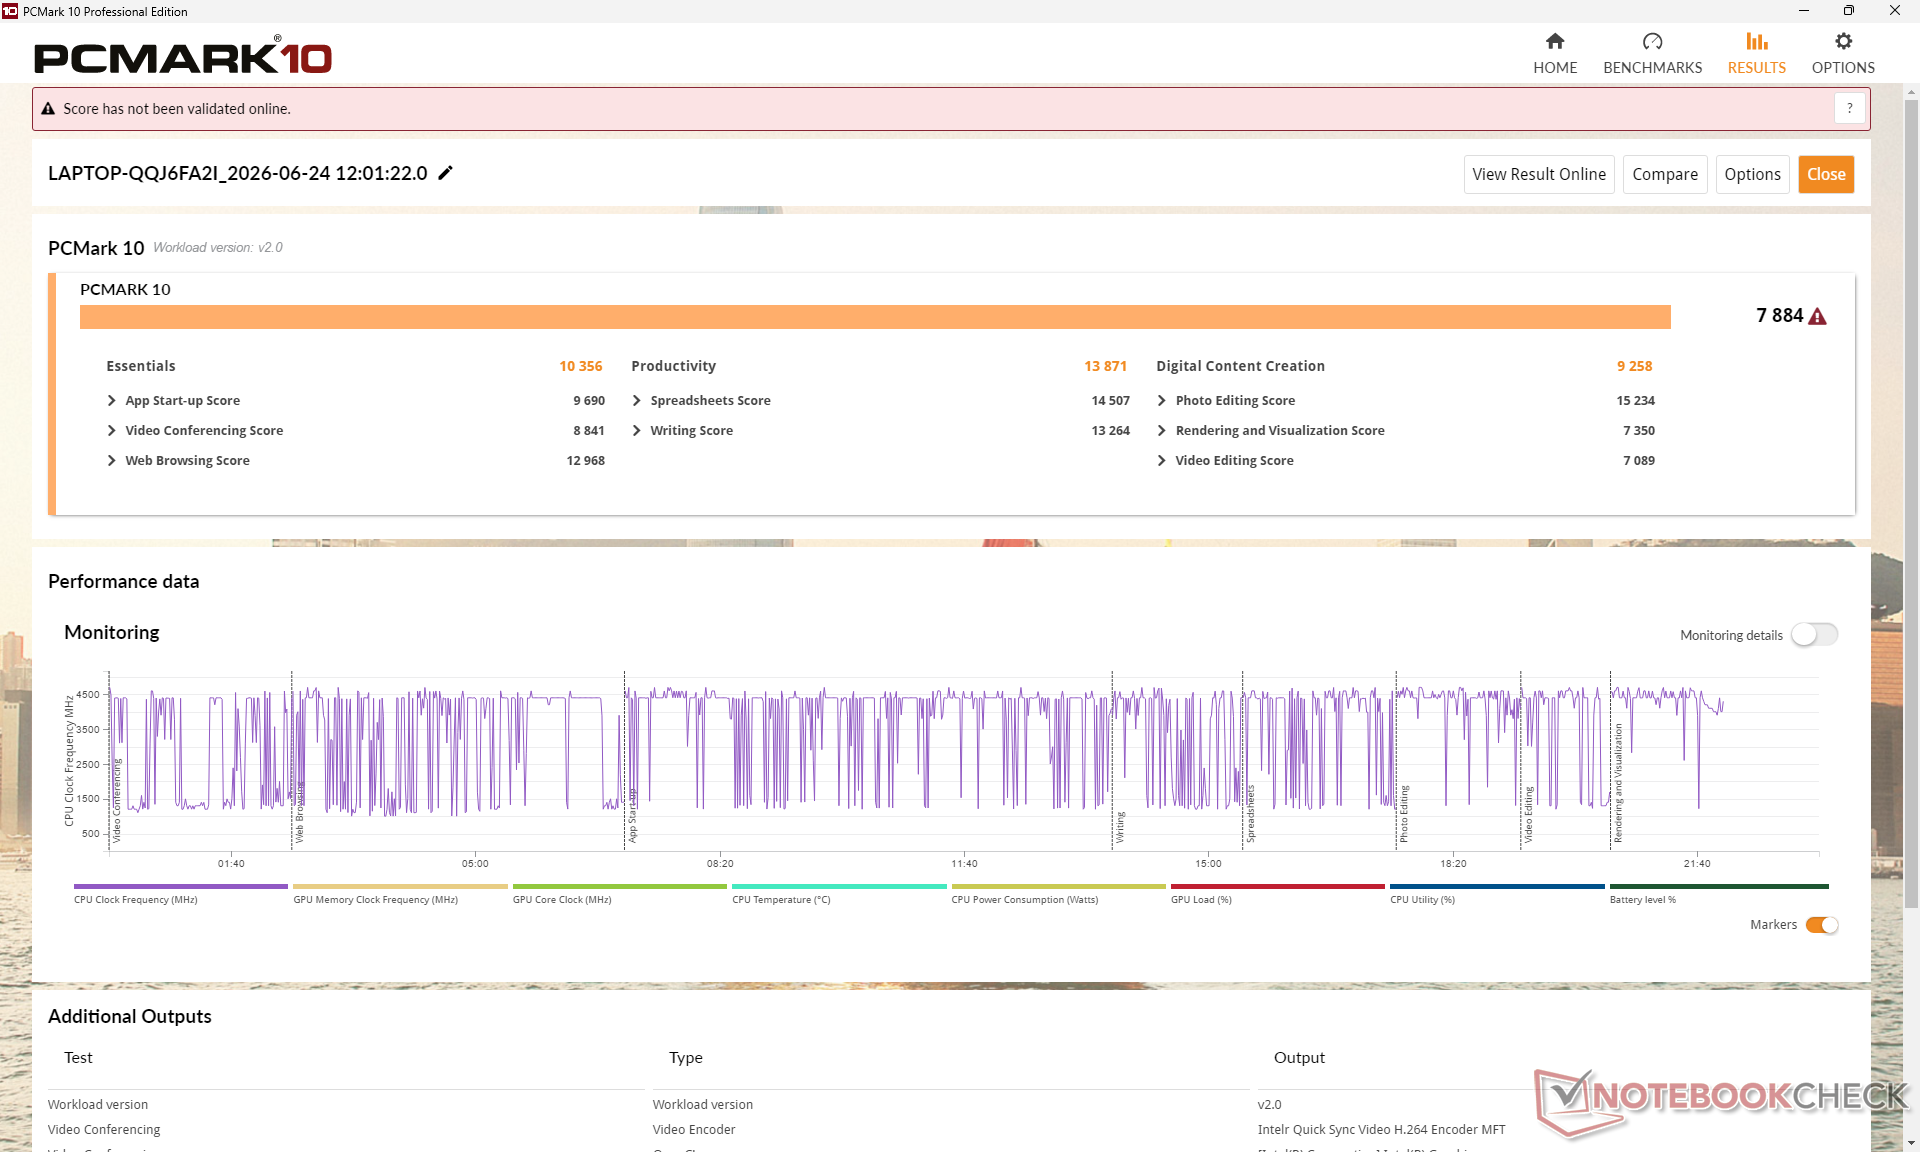
| PCMark 10 Score | 7884 points | |
| Help | ||
AIDA64: Memory Copy | Memory Read | Memory Write | Memory Latency
| AIDA64 / Memory Copy | |
| HP EliteBook X Flip G1i 14 AI Intel Core Ultra 7 258V, Arc 140V | 114336 MB/s+9% |
| Lenovo ThinkPad X1 2-in-1 Gen 10 Intel Core Ultra 7 258V, Arc 140V | 110053 MB/s+5% |
| Lenovo ThinkPad X1 2-in-1 Gen 11 Intel Core Ultra 7 355, Intel Graphics 4 Xe3 PTL | 104737 MB/s |
| Average Intel Core Ultra 7 355 (97301 – 105135, n=3) | 102391 MB/s-2% |
| Lenovo Yoga Book 9 14IAH10 Intel Core Ultra 7 255H, Arc 140T | 98328 MB/s-6% |
| Dell Latitude 7450 2-in-1 Intel Core Ultra 7 165U, Graphics 4-Core iGPU (Arrow Lake) | 73507 MB/s-30% |
* … smaller is better
DPC Latency
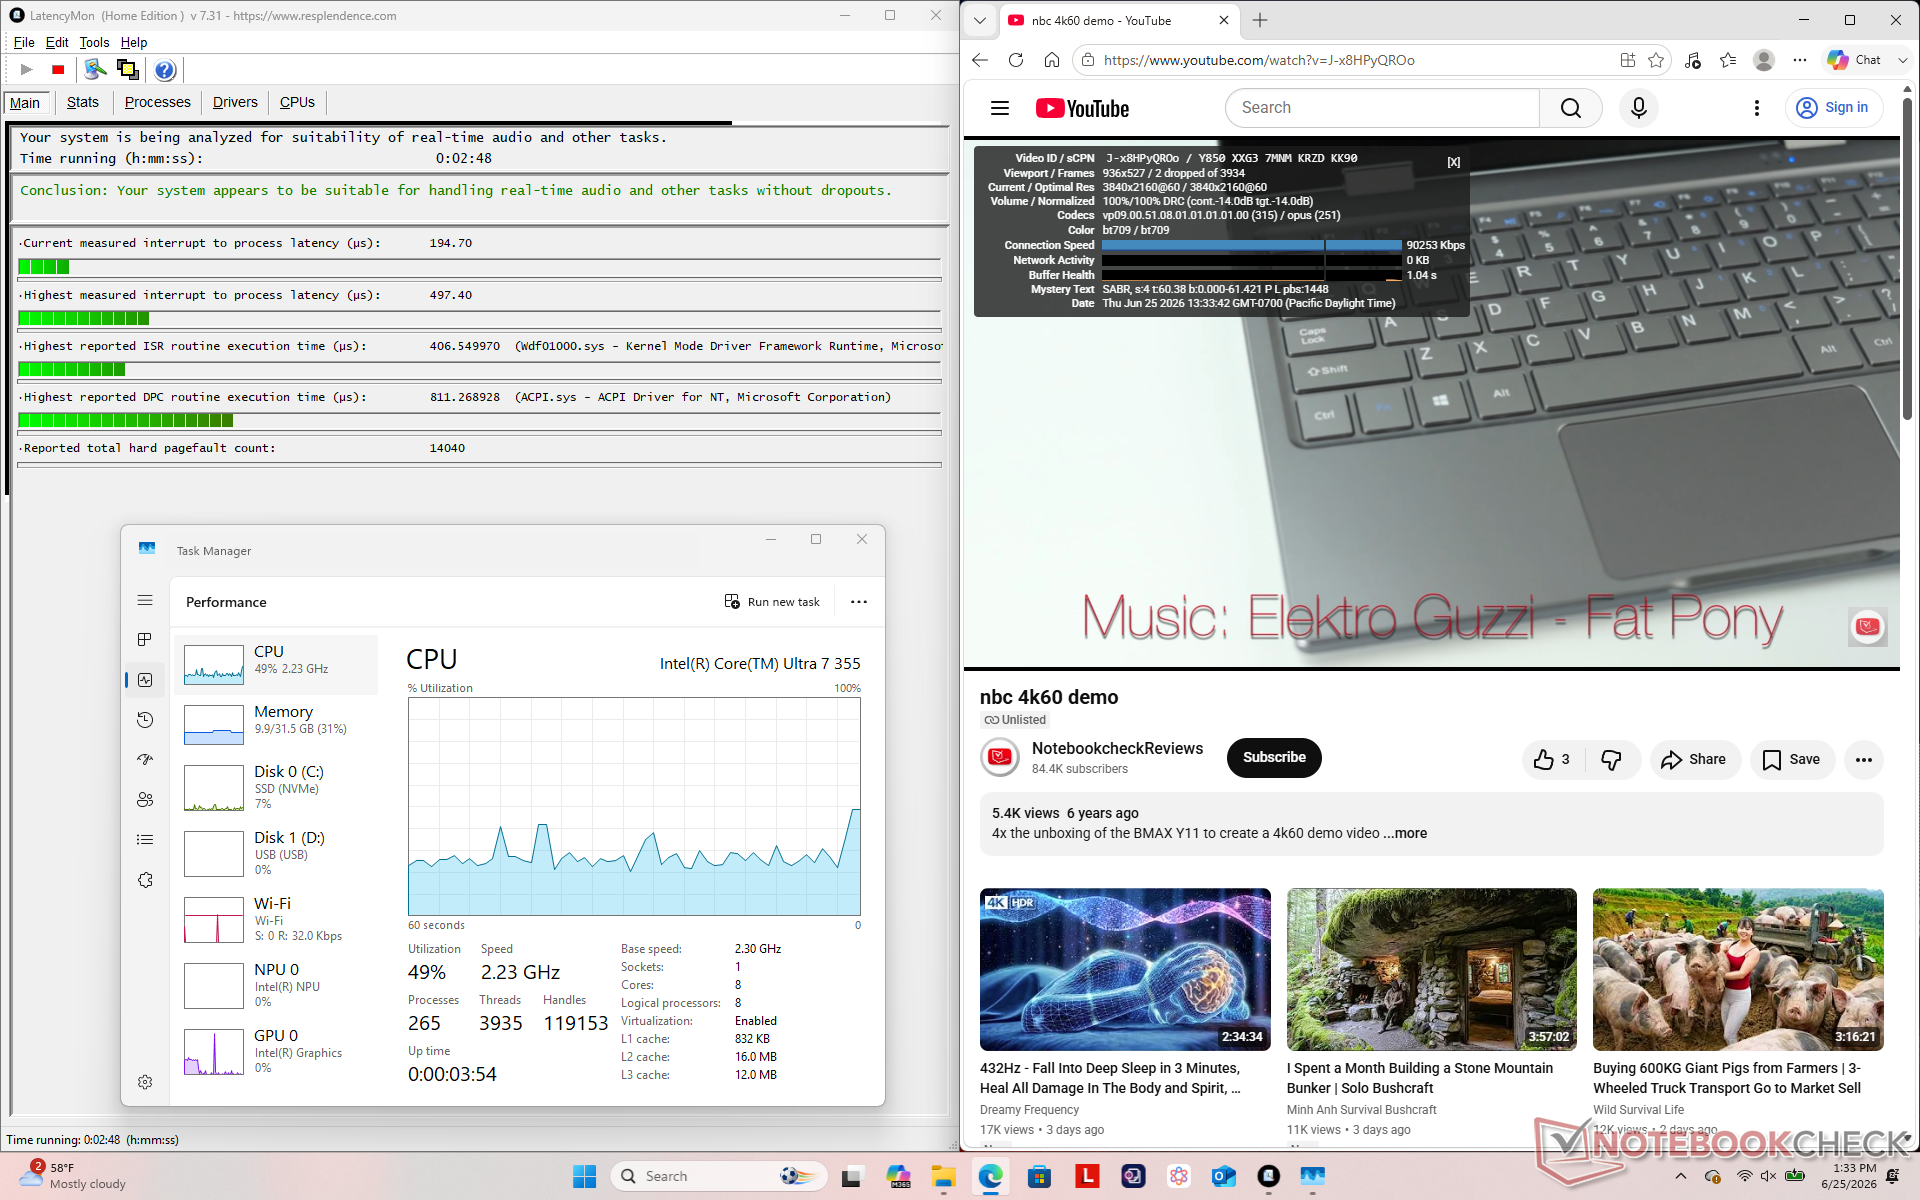
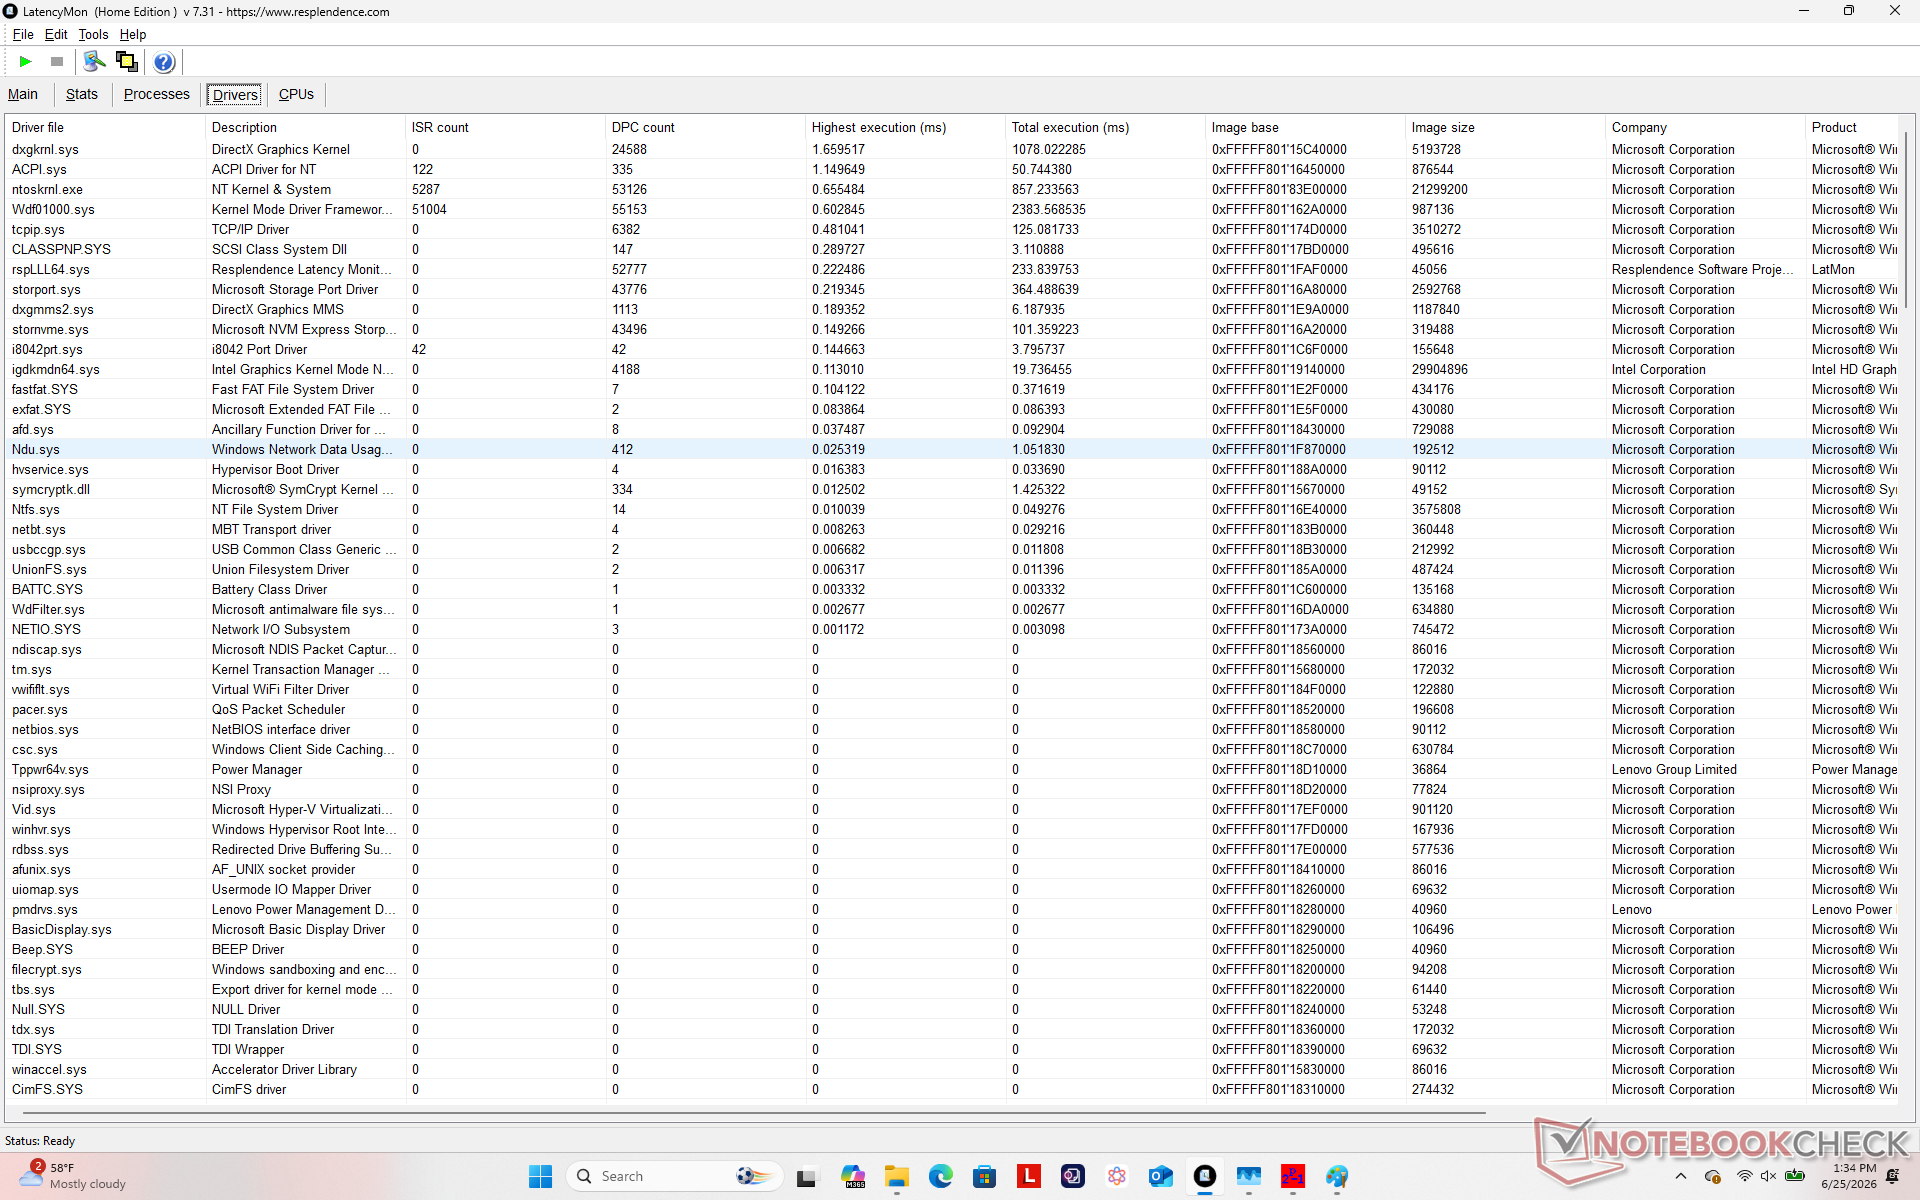
| DPC Latencies / LatencyMon – interrupt to process latency (max), Web, Youtube, Prime95 | |
| Lenovo Yoga Book 9 14IAH10 Arc 140T, Ultra 7 255H, Samsung PM9C1a MZAL81T0HDLB | 2805.7 μs * |
| HP EliteBook X Flip G1i 14 AI Arc 140V, Core Ultra 7 258V, Western Digital PC SN5000S SDEPNSJ-1T00-1006 | 924 μs * |
| Dell Latitude 7450 2-in-1 Graphics 4-Core iGPU (Arrow Lake), Ultra 7 165U, Micron 2550 512GB | 909.7 μs * |
| Lenovo ThinkPad X1 2-in-1 Gen 10 Arc 140V, Core Ultra 7 258V | 779 μs * |
| Asus ExpertBook Ultra B9406CAA Arc B390 Panther Lake iGPU, Ultra X7 358H, Samsung PM9E1 MZVLC2T0HBLD | 398 μs * |
* … smaller is better
Storage Devices
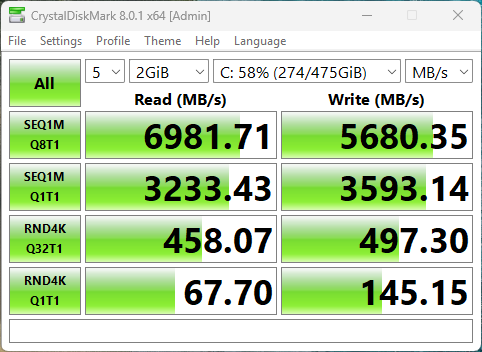
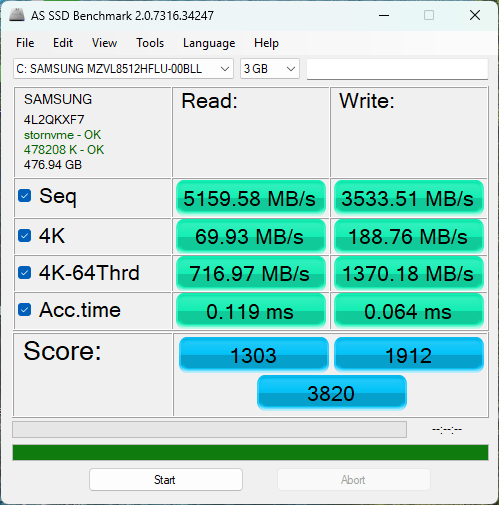

Samsung PM9C1b MZVL8512HFLU-00BLL
CDM 5/6 Read Seq Q32T1: 6983 MB/s
CDM 5/6 Write Seq Q32T1: 5804 MB/s
CDM 5/6 Read 4K Q32T1: 460.4 MB/s
CDM 5/6 Write 4K Q32T1: 488.9 MB/s
CDM 5 Read Seq: 3184 MB/s
CDM 5 Write Seq: 832.6 MB/s
CDM 5/6 Read 4K: 66.21 MB/s
CDM 5/6 Write 4K: 144.6 MB/s
Drive Performance rating | DiskSpd | AS SSD
| Drive Performance rating – Percent | |
| Asus ExpertBook Ultra B9406CAA Samsung PM9E1 MZVLC2T0HBLD | 86.8 pt+27% |
| Lenovo Yoga Book 9 14IAH10 Samsung PM9C1a MZAL81T0HDLB | 72.1 pt+5% |
| Lenovo ThinkPad X1 2-in-1 Gen 11 Samsung PM9C1b MZVL8512HFLU-00BLL | 68.2 pt0% |
| Lenovo ThinkPad X1 2-in-1 Gen 10 | 59.4 pt-13% |
| Dell Latitude 7450 2-in-1 Micron 2550 512GB | 59.1 pt-14% |
| HP EliteBook X Flip G1i 14 AI Western Digital PC SN5000S SDEPNSJ-1T00-1006 | 58.7 pt-14% |
* … smaller is better
Disk Throttling: DiskSpd Read Loop, Queue Depth 8
0140280420560700840980112012601400154016801820196021002240238025202660280029403080322033603500364037803920406042004340448046204760490050405180532054605600574058806020616063006440658067206860
Lenovo ThinkPad X1 2-in-1 Gen 11 Samsung PM9C1b MZVL8512HFLU-00BLL; diskspd 2.0.17 f: Ø6935 (5135.72-6978.79) MB/s
Lenovo ThinkPad X1 2-in-1 Gen 10 ; diskspd 2.0.17 f: Ø6583 (5853.15-6607.08) MB/s
GPU Performance
The integrated Intel Graphics 4 Xe3 is slower than the Arc 140V in last year’s model, but overall performance is more consistent as shown by our Cyberpunk 2077 graph below. Users demanding over 2x faster graphics performance can upgrade to the Core Ultra X7 368H SKU which comes with the highly praised Arc B390.
| Power Profile | Graphics Score | Physics Score | Combined Score |
| Performance Mode | 7227 | 21534 | 2329 |
| Balanced Mode | 7093 (-2%) | 21207 (-2%) | 2351 |
| Battery Power | 7003 (-3%) | 21193 (-2%) | 2336 |
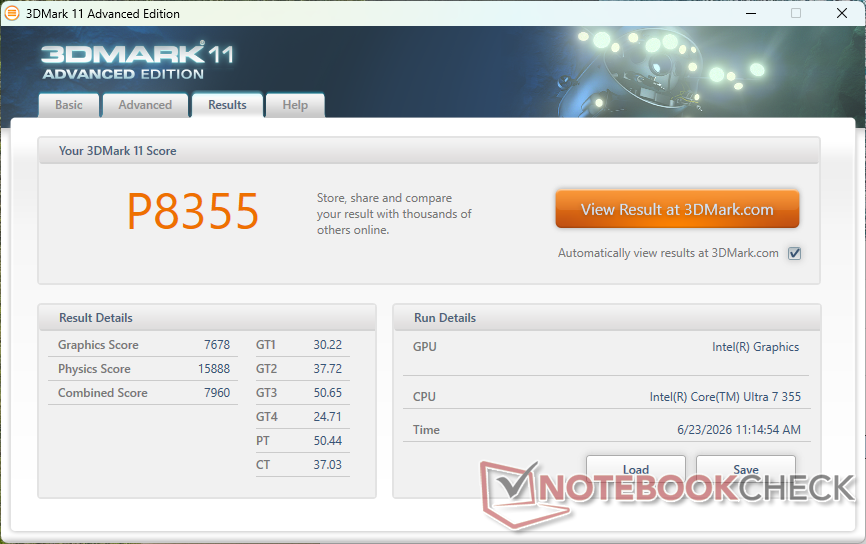
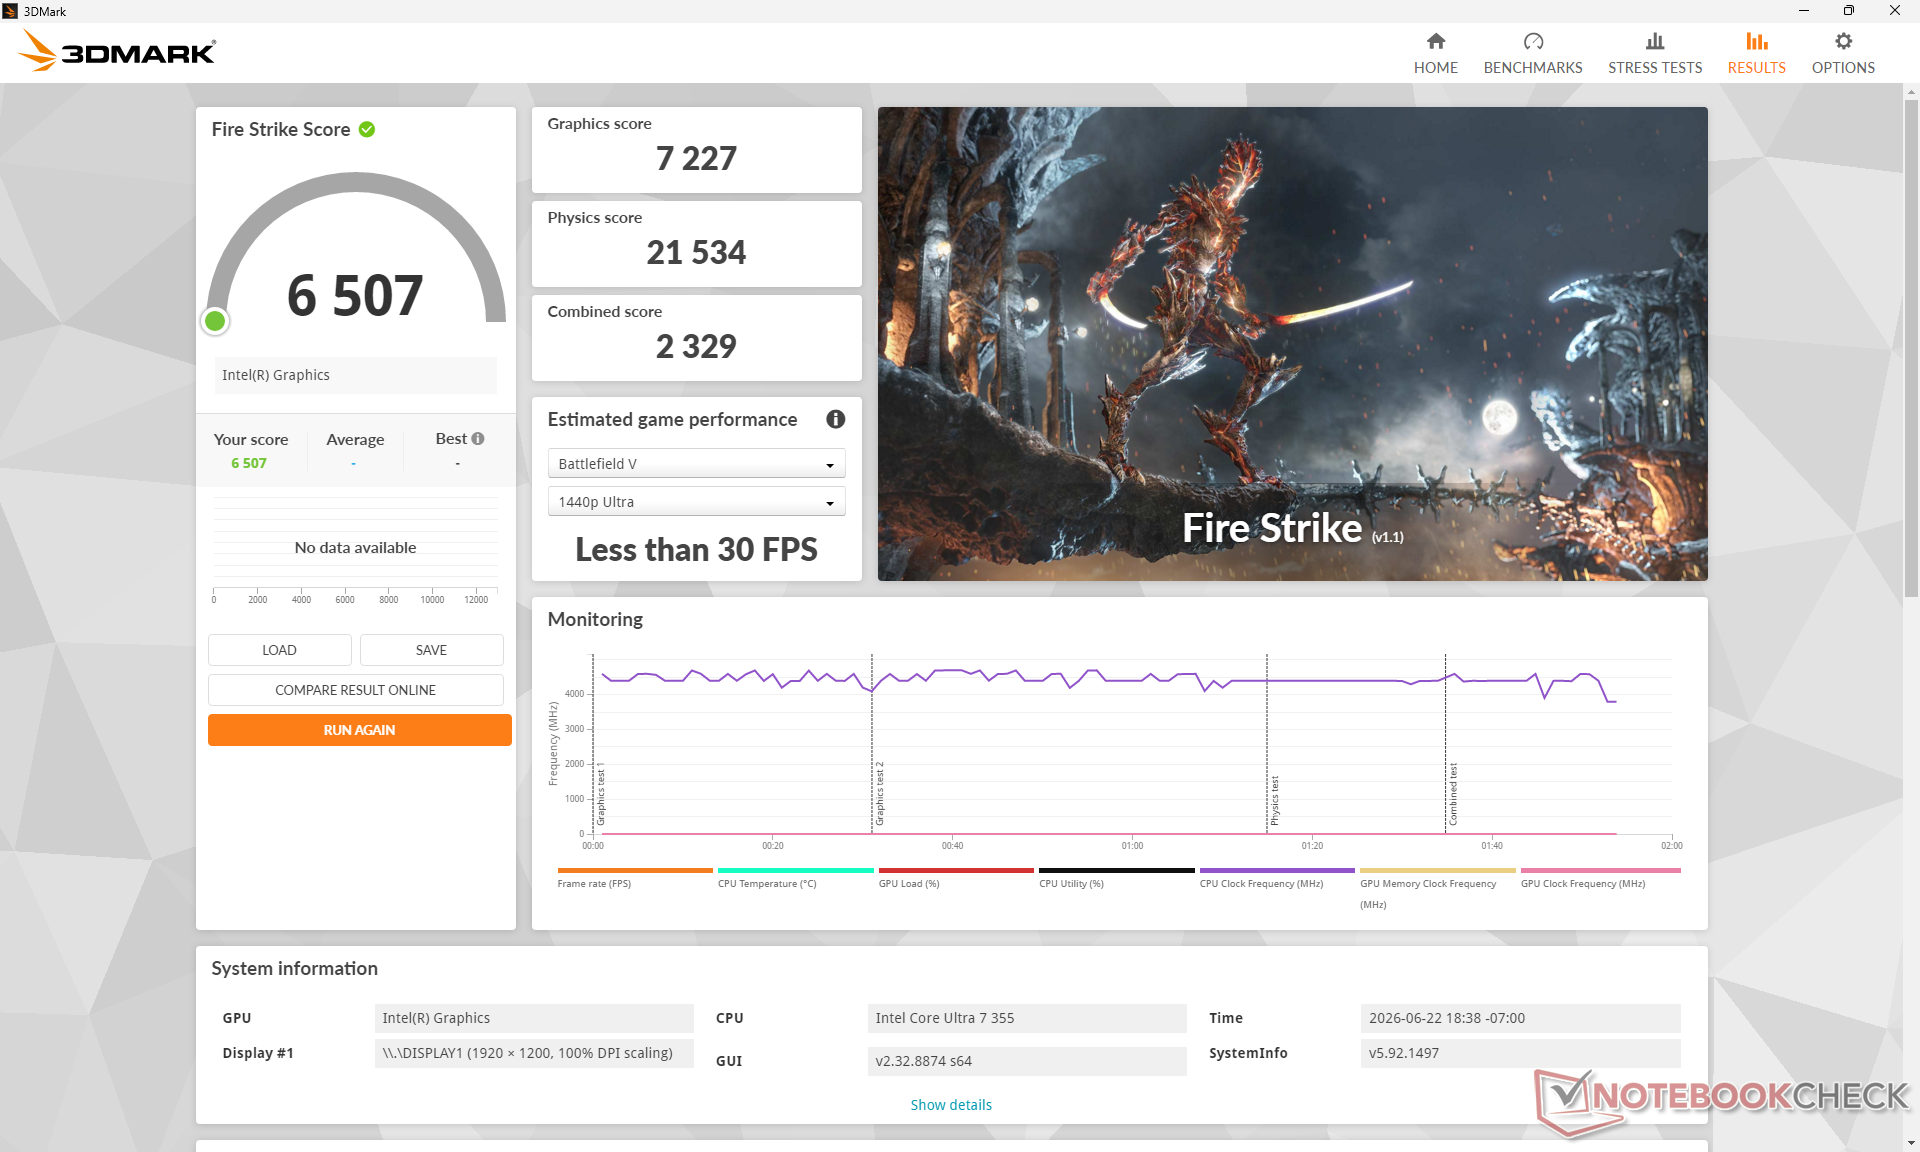
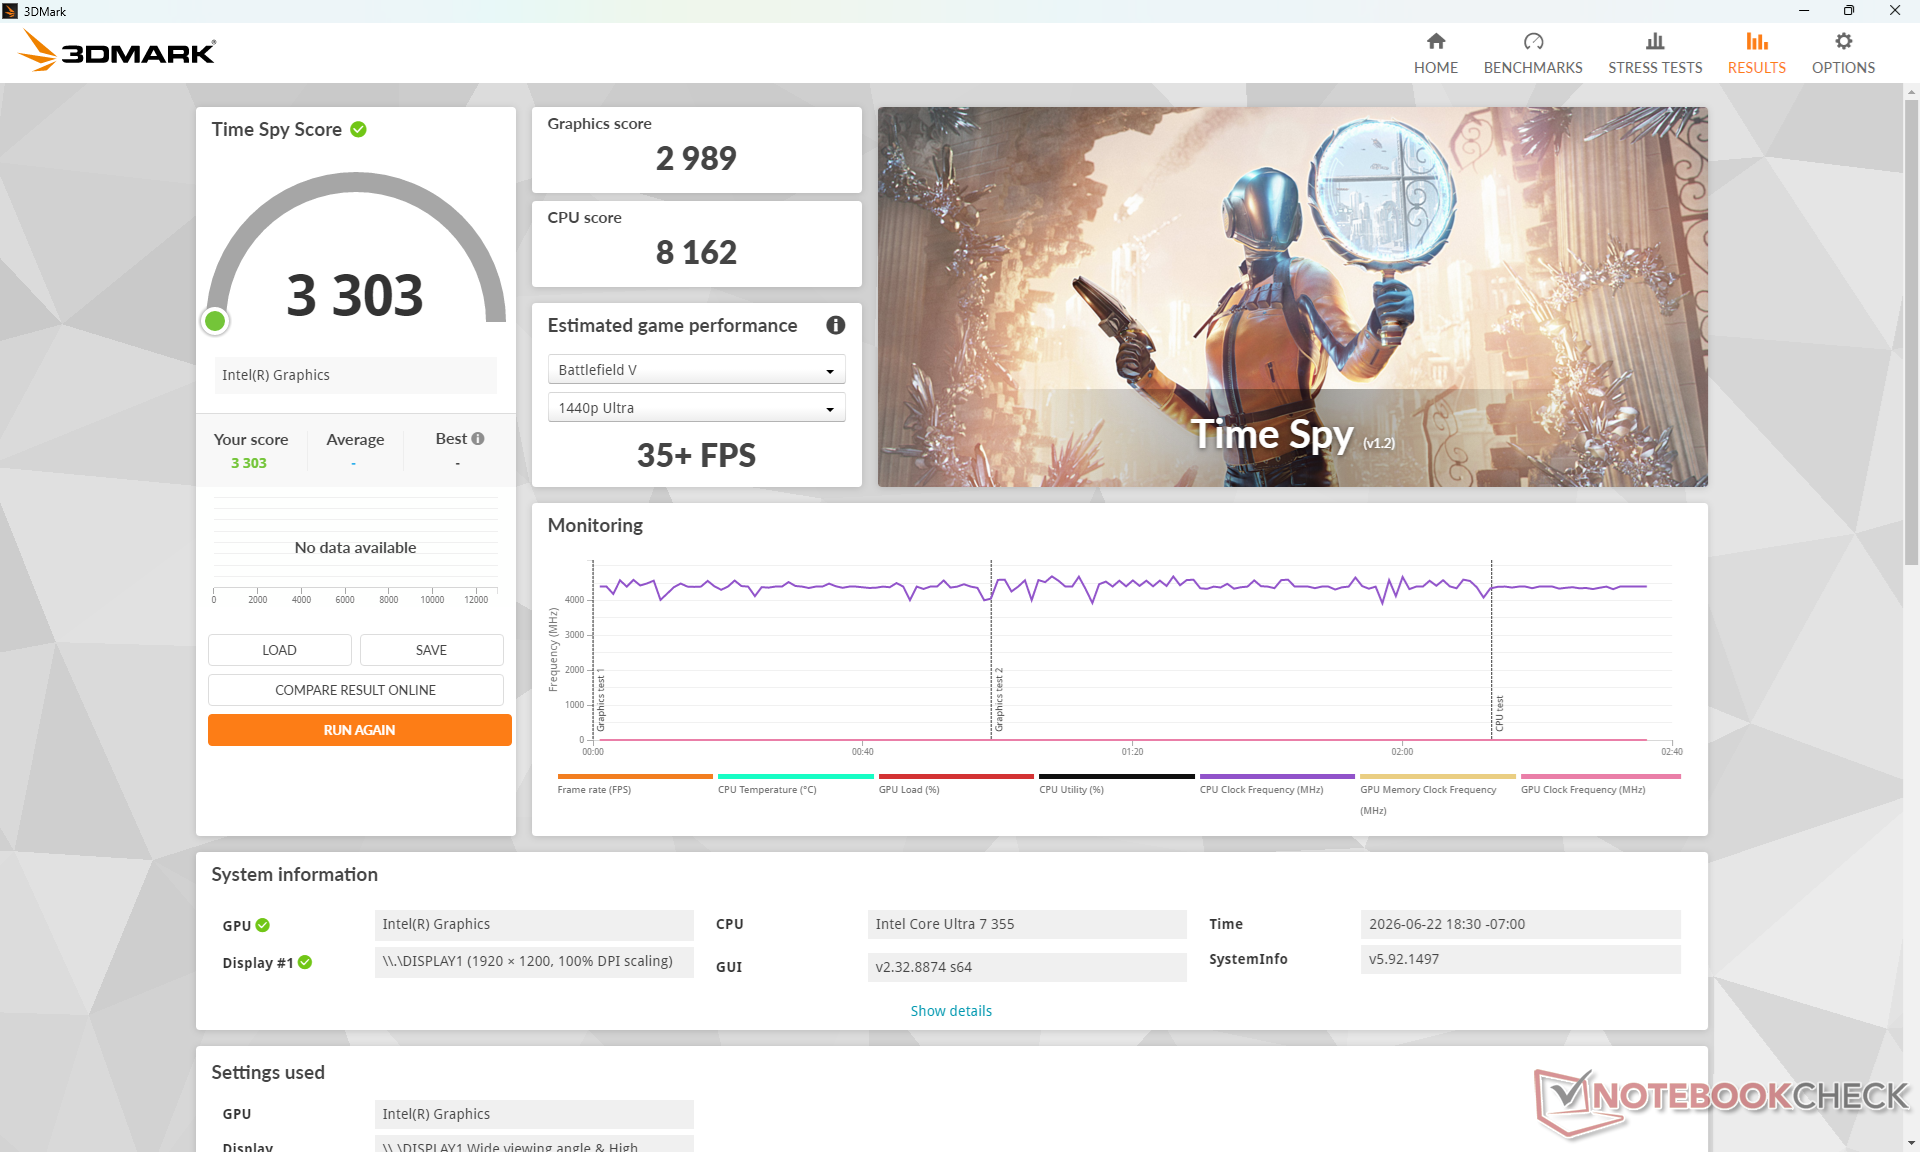
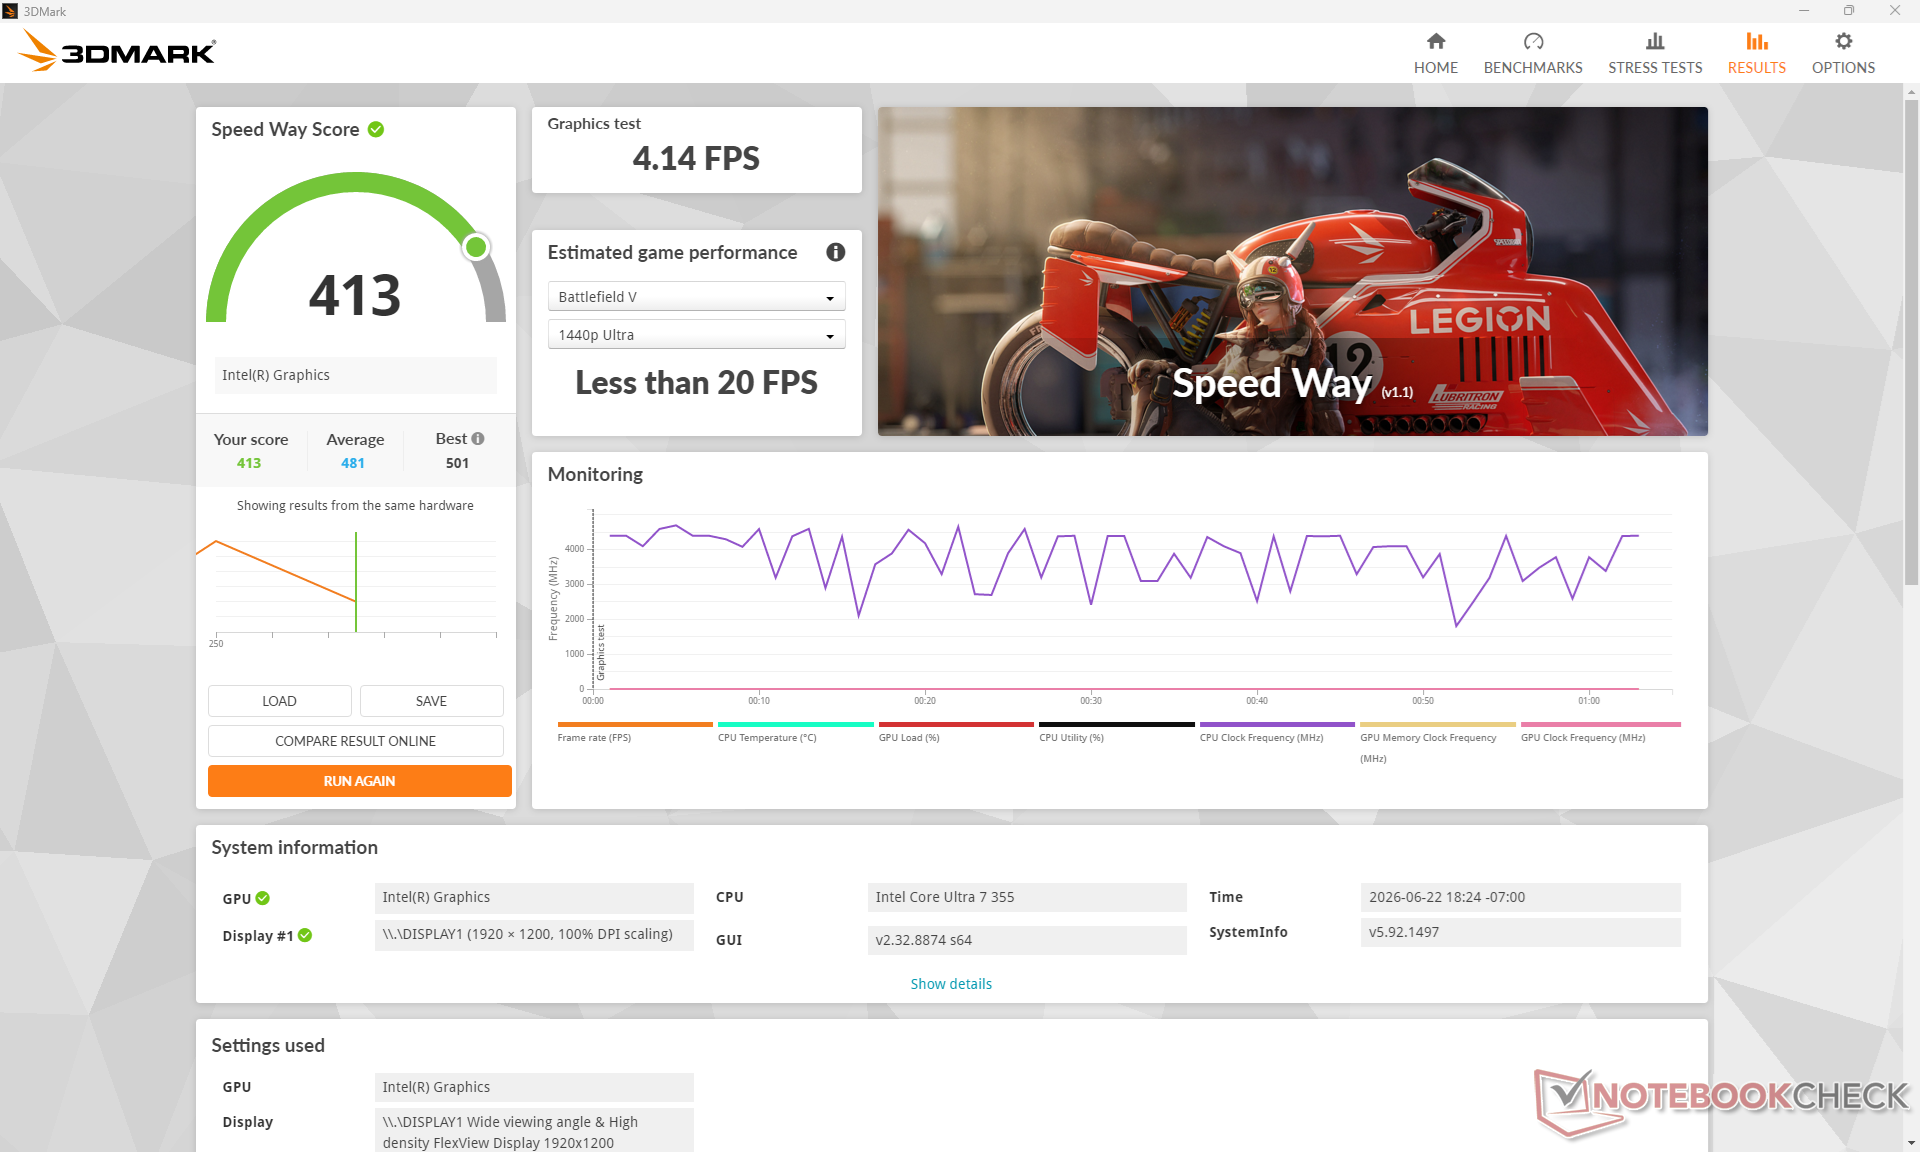
3DMark Performance rating | 3DMark 11 | 3DMark
| 3DMark Performance rating – Percent | |
| Asus ExpertBook Ultra B9406CAA Intel Arc B390 12 Xe3 Panther Lake iGPU, Intel Core Ultra X7 358H | 99.7 pt+46% |
| HP OmniBook Ultra 14 Core Ultra X9 Intel Arc B390 12 Xe3 Panther Lake iGPU, Intel Core Ultra X9 388H | 96.7 pt+41% |
| HP EliteBook X Flip G1i 14 AI Intel Arc Graphics 140V, Intel Core Ultra 7 258V | 62 pt-9% |
| Lenovo ThinkPad X1 2-in-1 Gen 10 Intel Arc Graphics 140V, Intel Core Ultra 7 258V | 61.3 pt-10% |
| Lenovo Yoga Book 9 14IAH10 Intel Arc Graphics 140T, Intel Core Ultra 7 255H | 58.3 pt-15% |
| Lenovo ThinkPad X1 2-in-1 Gen 11 Intel Graphics 4 Xe3 Panther Lake iGPU, Intel Core Ultra 7 355 | 42.9 pt-37% |
| Lenovo ThinkPad T14 Gen 7 21WN00A0GE Intel Graphics 4 Xe3 Panther Lake iGPU, Intel Core Ultra 5 325 | 40.6 pt-41% |
| Average Intel Graphics 4 Xe3 Panther Lake iGPU | 40 pt-42% |
| Dell Latitude 7450 2-in-1 Intel Graphics 4-Core iGPU (Meteor / Arrow Lake), Intel Core Ultra 7 165U | 34 pt-50% |
| Lenovo ThinkPad X1 Carbon Gen 13 21NX008PGE Intel Graphics 4-Core iGPU (Meteor / Arrow Lake), Intel Core Ultra 5 225U | 31.3 pt-54% |
| Lenovo Yoga Slim 7a 14AGP11 AMD Radeon 840M, AMD Ryzen AI 7 445 | 26.6 pt-61% |
| Lenovo IdeaPad 5i 2-in-1 14IPH11 Intel Graphics 2 Xe3 Panther Lake iGPU, Intel Core Ultra 5 322 | 19.5 pt-71% |
| 3DMark 11 Performance | 8355 points | |
| 3DMark Cloud Gate Standard Score | 29665 points | |
| 3DMark Fire Strike Score | 6507 points | |
| 3DMark Time Spy Score | 3303 points | |
| Help | ||
| Blender | |
| v3.3 Classroom CPU | |
| Lenovo IdeaPad 5i 2-in-1 14IPH11 Intel Graphics 2 Xe3 Panther Lake iGPU, Intel Core Ultra 5 322 | 715 Seconds *-49% |
| Dell Latitude 7450 2-in-1 Intel Graphics 4-Core iGPU (Meteor / Arrow Lake), Intel Core Ultra 7 165U | 657 Seconds *-37% |
| Lenovo ThinkPad X1 2-in-1 Gen 10 Intel Arc Graphics 140V, Intel Core Ultra 7 258V | 610 Seconds *-27% |
| HP EliteBook X Flip G1i 14 AI Intel Arc Graphics 140V, Intel Core Ultra 7 258V | 599 Seconds *-25% |
| Lenovo ThinkPad T14 Gen 7 21WN00A0GE Intel Graphics 4 Xe3 Panther Lake iGPU, Intel Core Ultra 5 325 | 569 Seconds *-19% |
| Lenovo Yoga Slim 7a 14AGP11 AMD Radeon 840M, AMD Ryzen AI 7 445 | 518 Seconds *-8% |
| Lenovo ThinkPad X1 Carbon Gen 13 21NX008PGE Intel Graphics 4-Core iGPU (Meteor / Arrow Lake), Intel Core Ultra 5 225U | 512 Seconds *-7% |
| Lenovo ThinkPad X1 2-in-1 Gen 11 Intel Graphics 4 Xe3 Panther Lake iGPU, Intel Core Ultra 7 355 | 479 Seconds * |
| Average Intel Graphics 4 Xe3 Panther Lake iGPU (332 – 569, n=9) | 478 Seconds *-0% |
| Lenovo Yoga Book 9 14IAH10 Intel Arc Graphics 140T, Intel Core Ultra 7 255H | 365 Seconds *+24% |
| HP OmniBook Ultra 14 Core Ultra X9 Intel Arc B390 12 Xe3 Panther Lake iGPU, Intel Core Ultra X9 388H | 326 Seconds *+32% |
| Asus ExpertBook Ultra B9406CAA Intel Arc B390 12 Xe3 Panther Lake iGPU, Intel Core Ultra X7 358H | 288 Seconds *+40% |
| v3.3 Classroom oneAPI/Intel | |
| Dell Latitude 7450 2-in-1 Intel Graphics 4-Core iGPU (Meteor / Arrow Lake), Intel Core Ultra 7 165U | 382 Seconds *-63% |
| HP EliteBook X Flip G1i 14 AI Intel Arc Graphics 140V, Intel Core Ultra 7 258V | 377 Seconds *-60% |
| Average Intel Graphics 4 Xe3 Panther Lake iGPU (235 – 257, n=5) | 245 Seconds *-4% |
| Lenovo ThinkPad X1 2-in-1 Gen 11 Intel Graphics 4 Xe3 Panther Lake iGPU, Intel Core Ultra 7 355 | 235 Seconds * |
| Lenovo ThinkPad X1 2-in-1 Gen 10 Intel Arc Graphics 140V, Intel Core Ultra 7 258V | 209 Seconds *+11% |
| Lenovo Yoga Book 9 14IAH10 Intel Arc Graphics 140T, Intel Core Ultra 7 255H | 147 Seconds *+37% |
| Asus ExpertBook Ultra B9406CAA Intel Arc B390 12 Xe3 Panther Lake iGPU, Intel Core Ultra X7 358H | 110 Seconds *+53% |
| HP OmniBook Ultra 14 Core Ultra X9 Intel Arc B390 12 Xe3 Panther Lake iGPU, Intel Core Ultra X9 388H | 105 Seconds *+55% |
| v4.3 Barbershop CPU | |
| Lenovo ThinkPad X1 2-in-1 Gen 10 Intel Arc Graphics 140V, Intel Core Ultra 7 258V | 3303 Seconds *-34% |
| Lenovo ThinkPad X1 2-in-1 Gen 11 Intel Graphics 4 Xe3 Panther Lake iGPU, Intel Core Ultra 7 355 | 2466 Seconds * |
| Average Intel Graphics 4 Xe3 Panther Lake iGPU (1709 – 2737, n=5) | 2429 Seconds *+2% |
| Lenovo Yoga Book 9 14IAH10 Intel Arc Graphics 140T, Intel Core Ultra 7 255H | 1839 Seconds *+25% |
| HP OmniBook Ultra 14 Core Ultra X9 Intel Arc B390 12 Xe3 Panther Lake iGPU, Intel Core Ultra X9 388H | 1609 Seconds *+35% |
| Asus ExpertBook Ultra B9406CAA Intel Arc B390 12 Xe3 Panther Lake iGPU, Intel Core Ultra X7 358H | 1439 Seconds *+42% |
| v4.3 Barbershop oneAPI | |
| Lenovo Yoga Book 9 14IAH10 Intel Arc Graphics 140T, Intel Core Ultra 7 255H | 1037 Seconds *-26% |
| Average Intel Graphics 4 Xe3 Panther Lake iGPU (823 – 1015, n=5) | 911 Seconds *-11% |
| Lenovo ThinkPad X1 2-in-1 Gen 10 Intel Arc Graphics 140V, Intel Core Ultra 7 258V | 832 Seconds *-1% |
| Lenovo ThinkPad X1 2-in-1 Gen 11 Intel Graphics 4 Xe3 Panther Lake iGPU, Intel Core Ultra 7 355 | 823 Seconds * |
| Asus ExpertBook Ultra B9406CAA Intel Arc B390 12 Xe3 Panther Lake iGPU, Intel Core Ultra X7 358H | 383 Seconds *+53% |
| HP OmniBook Ultra 14 Core Ultra X9 Intel Arc B390 12 Xe3 Panther Lake iGPU, Intel Core Ultra X9 388H | 371 Seconds *+55% |
* … smaller is better
Performance rating | Cyberpunk 2077 | Baldur’s Gate 3 | Final Fantasy XV Benchmark | Strange Brigade | Dota 2 Reborn | X-Plane 11.11
| Performance rating – Percent | |
| Asus ExpertBook Ultra B9406CAA Intel Core Ultra X7 358H, Intel Arc B390 12 Xe3 Panther Lake iGPU | 100 pt+46% |
| HP EliteBook X Flip G1i 14 AI Intel Core Ultra 7 258V, Intel Arc Graphics 140V | 67.1 pt-2% |
| Lenovo ThinkPad X1 2-in-1 Gen 10 Intel Core Ultra 7 258V, Intel Arc Graphics 140V | 62.9 pt-8% |
| Lenovo Yoga Book 9 14IAH10 Intel Core Ultra 7 255H, Intel Arc Graphics 140T | 61.9 pt-10% |
| Lenovo ThinkPad X1 2-in-1 Gen 11 Intel Core Ultra 7 355, Intel Graphics 4 Xe3 Panther Lake iGPU | 55.8 pt-18% |
| Dell Latitude 7450 2-in-1 Intel Core Ultra 7 165U, Intel Graphics 4-Core iGPU (Meteor / Arrow Lake) | 40.1 pt-41% |
Baldur’s Gate 3 | GTA V | Final Fantasy XV Benchmark | X-Plane 11.11 | Strange Brigade | Cyberpunk 2077 | F1 24 | Dota 2 Reborn
| Baldur’s Gate 3 | |
| 1920×1080 Low Preset AA:SM | |
| HP OmniBook Ultra 14 Core Ultra X9 Intel Core Ultra X9 388H, Intel Arc B390 12 Xe3 Panther Lake iGPU | 72.2 (56.9min, 59.7P0.1, 61.6P1) fps+122% |
| Asus ExpertBook Ultra B9406CAA Intel Core Ultra X7 358H, Intel Arc B390 12 Xe3 Panther Lake iGPU | 71.4 (61min, 62.1P0.1, 66.4P1) fps+120% |
| HP EliteBook X Flip G1i 14 AI Intel Core Ultra 7 258V, Intel Arc Graphics 140V | 47 fps+45% |
| Lenovo ThinkPad X1 2-in-1 Gen 10 Intel Core Ultra 7 258V, Intel Arc Graphics 140V | 41.8 fps+29% |
| Lenovo Yoga Book 9 14IAH10 Intel Core Ultra 7 255H, Intel Arc Graphics 140T | 35.6 fps+10% |
| Lenovo ThinkPad X1 2-in-1 Gen 11 Intel Core Ultra 7 355, Intel Graphics 4 Xe3 Panther Lake iGPU | 32.5 (28.9min, 29.2P0.1, 30P1) fps |
| Average Intel Graphics 4 Xe3 Panther Lake iGPU (27.4 – 33.3, n=8) | 30.8 fps-5% |
| Lenovo ThinkPad T14 Gen 7 21WN00A0GE Intel Core Ultra 5 325, Intel Graphics 4 Xe3 Panther Lake iGPU | 28.7 (19.9min, 20P0.1, 20P1) fps-12% |
| Dell Latitude 7450 2-in-1 Intel Core Ultra 7 165U, Intel Graphics 4-Core iGPU (Meteor / Arrow Lake) | 21.5 (16.9min, 17P0.1, 18.9P1) fps-34% |
| Lenovo Yoga Slim 7a 14AGP11 AMD Ryzen AI 7 445, AMD Radeon 840M | 20.6 (15.9min, 16.1P0.1, 17.2P1) fps-37% |
| Lenovo ThinkPad X1 Carbon Gen 13 21NX008PGE Intel Core Ultra 5 225U, Intel Graphics 4-Core iGPU (Meteor / Arrow Lake) | 17.8 (14.9min, 15P0.1, 15P1) fps-45% |
| 1920×1080 Medium Preset AA:T | |
| HP OmniBook Ultra 14 Core Ultra X9 Intel Core Ultra X9 388H, Intel Arc B390 12 Xe3 Panther Lake iGPU | 61.3 (54.8min, 56P0.1, 57.7P1) fps0% |
| Asus ExpertBook Ultra B9406CAA Intel Core Ultra X7 358H, Intel Arc B390 12 Xe3 Panther Lake iGPU | 60.8 (50.7min, 51.4P0.1, 55.8P1) fps-1% |
| HP EliteBook X Flip G1i 14 AI Intel Core Ultra 7 258V, Intel Arc Graphics 140V | 35.9 fps-41% |
| Lenovo ThinkPad X1 2-in-1 Gen 10 Intel Core Ultra 7 258V, Intel Arc Graphics 140V | 30.3 fps-51% |
| Lenovo Yoga Book 9 14IAH10 Intel Core Ultra 7 255H, Intel Arc Graphics 140T | 28.4 fps-54% |
| Lenovo ThinkPad X1 2-in-1 Gen 11 Intel Core Ultra 7 355, Intel Graphics 4 Xe3 Panther Lake iGPU | 27 (24.7min, 24.8P0.1, 25P1) fps-56% |
| Average Intel Graphics 4 Xe3 Panther Lake iGPU (21 – 27.1, n=8) | 24.5 fps-60% |
| Lenovo ThinkPad T14 Gen 7 21WN00A0GE Intel Core Ultra 5 325, Intel Graphics 4 Xe3 Panther Lake iGPU | 21 (15min, 15P0.1, 15.3P1) fps-66% |
| Lenovo Yoga Slim 7a 14AGP11 AMD Ryzen AI 7 445, AMD Radeon 840M | 17.6 (14.3min, 14.5P0.1, 15.9P1) fps-71% |
| Dell Latitude 7450 2-in-1 Intel Core Ultra 7 165U, Intel Graphics 4-Core iGPU (Meteor / Arrow Lake) | 16.1 (12.9min, 13P0.1, 13.3P1) fps-74% |
| 1920×1080 High Preset AA:T | |
| Asus ExpertBook Ultra B9406CAA Intel Core Ultra X7 358H, Intel Arc B390 12 Xe3 Panther Lake iGPU | 54.3 (45.6min, 47.8P0.1, 50P1) fps+89% |
| HP OmniBook Ultra 14 Core Ultra X9 Intel Core Ultra X9 388H, Intel Arc B390 12 Xe3 Panther Lake iGPU | 54 (47.6min, 48.5P0.1, 49.7P1) fps+88% |
| HP EliteBook X Flip G1i 14 AI Intel Core Ultra 7 258V, Intel Arc Graphics 140V | 31.8 fps+10% |
| Lenovo ThinkPad X1 2-in-1 Gen 10 Intel Core Ultra 7 258V, Intel Arc Graphics 140V | 28.8 fps0% |
| Lenovo Yoga Book 9 14IAH10 Intel Core Ultra 7 255H, Intel Arc Graphics 140T | 25.3 fps-12% |
| Lenovo ThinkPad X1 2-in-1 Gen 11 Intel Core Ultra 7 355, Intel Graphics 4 Xe3 Panther Lake iGPU | 23.7 (21.1min, 21.3P0.1, 21.9P1) fps-18% |
| Average Intel Graphics 4 Xe3 Panther Lake iGPU (18 – 23.7, n=8) | 21.2 fps-26% |
| Lenovo ThinkPad T14 Gen 7 21WN00A0GE Intel Core Ultra 5 325, Intel Graphics 4 Xe3 Panther Lake iGPU | 18 (15min, 15P0.1, 15P1) fps-37% |
| Dell Latitude 7450 2-in-1 Intel Core Ultra 7 165U, Intel Graphics 4-Core iGPU (Meteor / Arrow Lake) | 14.6 (10.7min, 10.9P0.1, 12P1) fps-49% |
| Lenovo Yoga Slim 7a 14AGP11 AMD Ryzen AI 7 445, AMD Radeon 840M | 13.4 (11.6min, 11.7P0.1, 12.2P1) fps-53% |
| 1920×1080 Ultra Preset AA:T | |
| HP OmniBook Ultra 14 Core Ultra X9 Intel Core Ultra X9 388H, Intel Arc B390 12 Xe3 Panther Lake iGPU | 53.5 (48.4min, 49.1P0.1, 50.4P1) fps+132% |
| Asus ExpertBook Ultra B9406CAA Intel Core Ultra X7 358H, Intel Arc B390 12 Xe3 Panther Lake iGPU | 53.4 (45.4min, 46.4P0.1, 49.5P1) fps+131% |
| HP EliteBook X Flip G1i 14 AI Intel Core Ultra 7 258V, Intel Arc Graphics 140V | 31.3 fps+35% |
| Lenovo ThinkPad X1 2-in-1 Gen 10 Intel Core Ultra 7 258V, Intel Arc Graphics 140V | 25.8 fps+12% |
| Lenovo Yoga Book 9 14IAH10 Intel Core Ultra 7 255H, Intel Arc Graphics 140T | 24.8 fps+7% |
| Lenovo ThinkPad X1 2-in-1 Gen 11 Intel Core Ultra 7 355, Intel Graphics 4 Xe3 Panther Lake iGPU | 23.1 (20.9min, 21P0.1, 21.5P1) fps |
| Average Intel Graphics 4 Xe3 Panther Lake iGPU (17.7 – 23.1, n=8) | 20.8 fps-10% |
| Lenovo ThinkPad T14 Gen 7 21WN00A0GE Intel Core Ultra 5 325, Intel Graphics 4 Xe3 Panther Lake iGPU | 17.7 (15min, 15P0.1, 15P1) fps-23% |
| Dell Latitude 7450 2-in-1 Intel Core Ultra 7 165U, Intel Graphics 4-Core iGPU (Meteor / Arrow Lake) | 13.9 (11.2min, 11.4P0.1, 12P1) fps-40% |
| Lenovo Yoga Slim 7a 14AGP11 AMD Ryzen AI 7 445, AMD Radeon 840M | 12.5 (9.87min, 9.93P0.1, 10.3P1) fps-46% |
| Lenovo ThinkPad X1 Carbon Gen 13 21NX008PGE Intel Core Ultra 5 225U, Intel Graphics 4-Core iGPU (Meteor / Arrow Lake) | 10.7 (8.57min, 8.57P0.1, 9.99P1) fps-54% |
Cyberpunk 2077 ultra FPS Chart
051015202520.6 fps Lenovo ThinkPad X1 2-in-1 Gen 1126.2
Lenovo ThinkPad X1 2-in-1 Gen 11 Ultra 7 355, Intel Graphics 4 Xe3 PTL: Ø19.6 (18.4-21.7) fps
Lenovo ThinkPad X1 2-in-1 Gen 10 Core Ultra 7 258V, Arc 140V: Ø25 (21-26.8) fps
| low | med. | high | ultra | |
|---|---|---|---|---|
| GTA V (2015) | 169.3 | 161.6 | 54.8 | 21.8 |
| Dota 2 Reborn (2015) | 128.1 | 99.2 | 82.1 | 84.9 |
| Final Fantasy XV Benchmark (2018) | 69 | 36.3 | 25.9 | |
| X-Plane 11.11 (2018) | 33 | 27.2 | 24.7 | |
| Strange Brigade (2018) | 192.1 | 76.2 | 62.1 | 53 |
| Baldur’s Gate 3 (2023) | 32.5 | 27 | 23.7 | 23.1 |
| Cyberpunk 2077 (2023) | 39.4 | 29.8 | 26.1 | 21.8 |
| F1 24 (2024) | 68 | 63.8 | 46.7 | 14.8 |
Emissions
System Noise
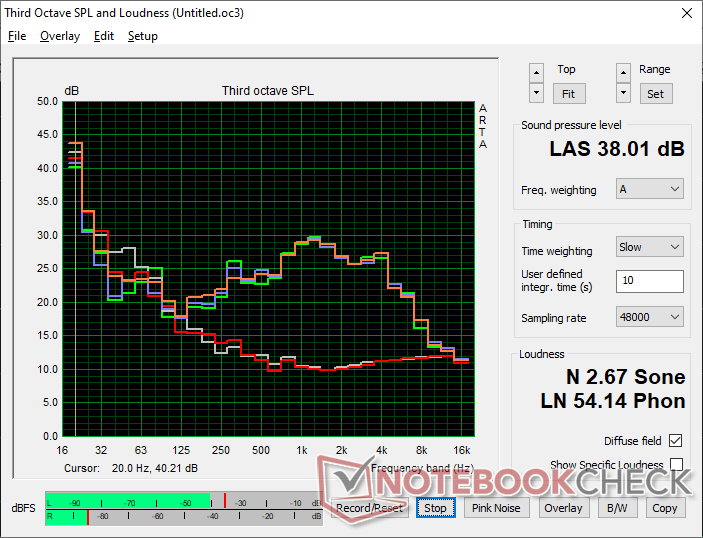
Fan noise and behavior are largely unchanged from last year’s design with similar ceilings.
Noise level
| Idle | 23.3 / 23.3 / 23.3 dB(A) | |
| Load | 38.1 / 38.1 dB(A) | |
 | ||
| 30 dB silent40 dB(A) audible50 dB(A) loud | ||
min:  , med: , med:  , max: , max:  Earthworks M23R, Arta (15 cm distance) environment noise: 23.3 dB(A) Earthworks M23R, Arta (15 cm distance) environment noise: 23.3 dB(A) | ||
dB(A)0102030405060708090Deep BassMiddle BassHigh BassLower RangeMidsHigher MidsLower HighsMid HighsUpper HighsSuper Highs2043.740.841.542.341.12533.630.433.533.631.23127.625.530.63027.34023.92124.427.520.25023.323.123.32821.56323.423.424.525.222.7802321.420.923.62510020.218.919.418.718.21251817.615.517.617.716020.819.915.41619.62002119.815.214.118.925021.921.313.812.420.631523.625.114.313.325.940023.423.212.111.92350024.124.811.412.123.16302423.99.710.723.580027.127.111.411.827.31000292910.310.428.6125029.229.510.110.329.6160028.628.29.99.928.2200026.926.61010.326.8250025.625.610.310.625.7315026.225.910.61126.7400027.227.311.211.226.6500022.122.711.311.322.1630020.821.111.711.521.3800017.317.311.611.716.11000013.61411.911.913.31250012.713.11211.912.71600011.411.410.910.911.3SPL38.138.123.223.338N2.72.70.50.52.7median 23.4median 23.2median 11.4median 11.7median 23Delta4.24.41.71.34.6hearing rangehide medianFan NoiseLenovo ThinkPad X1 2-in-1 Gen 11
| Lenovo ThinkPad X1 2-in-1 Gen 11 Ultra 7 355, Intel Graphics 4 Xe3 PTL | Lenovo ThinkPad X1 2-in-1 Gen 10 Core Ultra 7 258V, Arc 140V | Lenovo Yoga Book 9 14IAH10 Ultra 7 255H, Arc 140T | HP EliteBook X Flip G1i 14 AI Core Ultra 7 258V, Arc 140V | Dell Latitude 7450 2-in-1 Ultra 7 165U, Graphics 4-Core iGPU (Arrow Lake) | Asus ExpertBook Ultra B9406CAA Ultra X7 358H, Arc B390 Panther Lake iGPU | |
|---|---|---|---|---|---|---|
| Noise | -1% | -6% | 10% | -0% | -1% | |
| off / environment * (dB) | 23.3 | 23.3 -0% | 23.9 -3% | 23 1% | 23.03 1% | 22.9 2% |
| Idle Minimum * (dB) | 23.3 | 23.3 -0% | 23.9 -3% | 23 1% | 23.53 -1% | 23.4 -0% |
| Idle Average * (dB) | 23.3 | 23.3 -0% | 23.9 -3% | 23 1% | 23.53 -1% | 23.4 -0% |
| Idle Maximum * (dB) | 23.3 | 23.3 -0% | 23.9 -3% | 23 1% | 23.53 -1% | 23.4 -0% |
| Load Average * (dB) | 38.1 | 38 -0% | 39.1 -3% | 27.14 29% | 38.54 -1% | 28.6 25% |
| Cyberpunk 2077 ultra * (dB) | 38.1 | 37.8 1% | 42 -10% | 31.65 17% | 38.2 -0% | 42.8 -12% |
| Load Maximum * (dB) | 38.1 | 40.6 -7% | 44.5 -17% | 31.65 17% | 38.21 -0% | 45.2 -19% |
* … smaller is better
Temperature
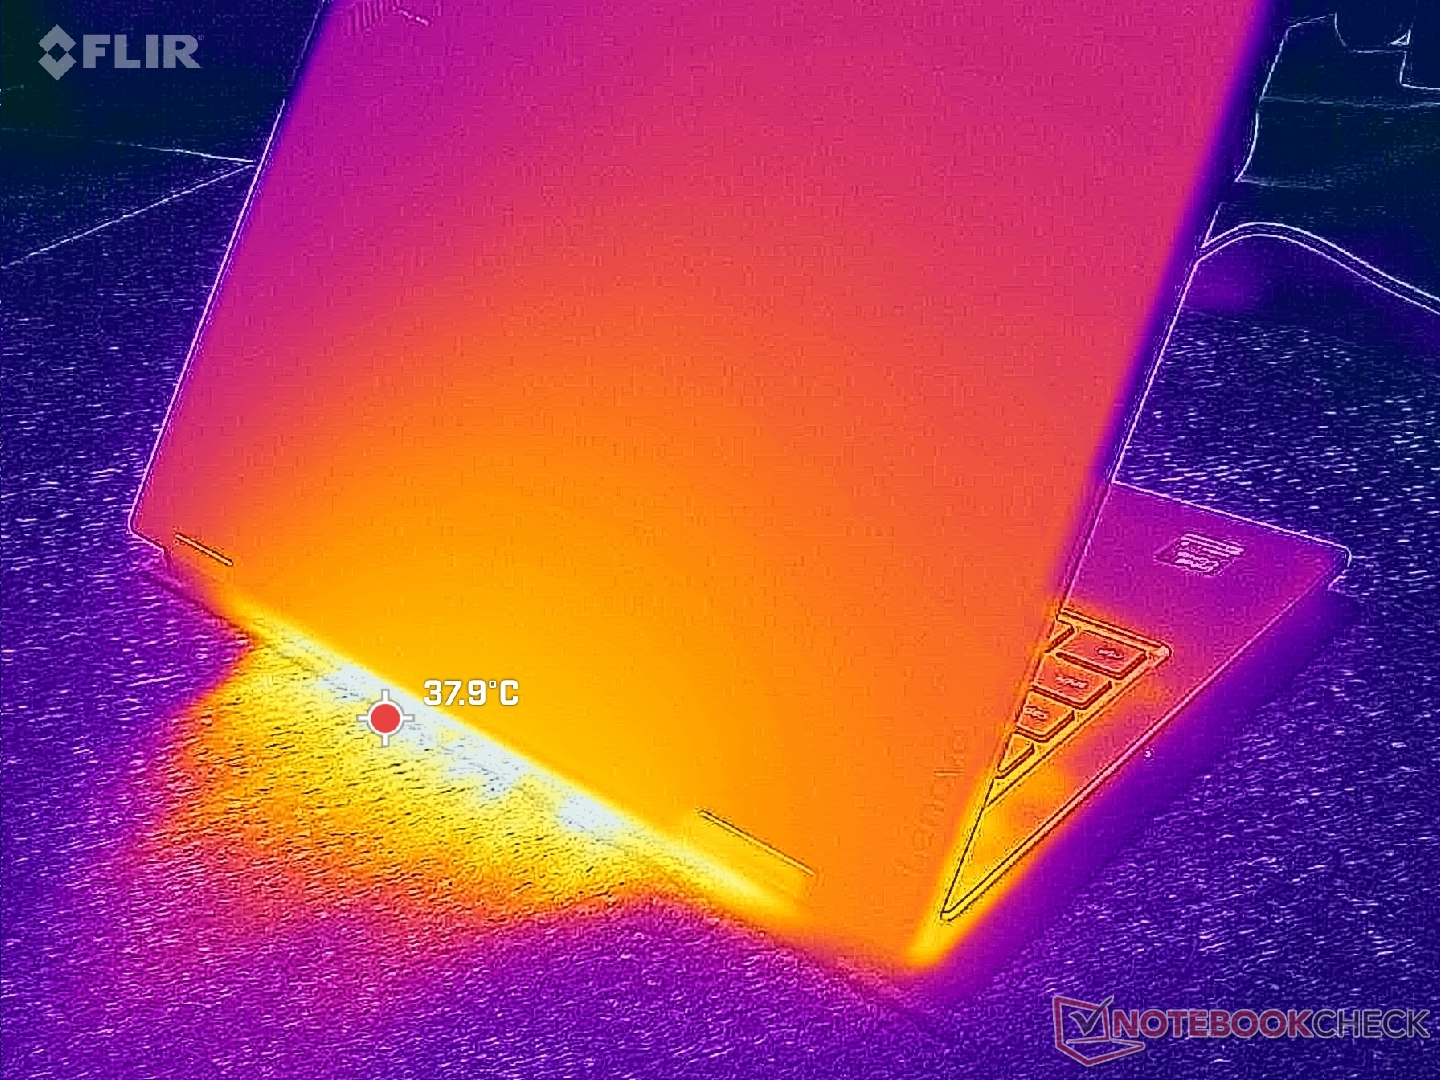
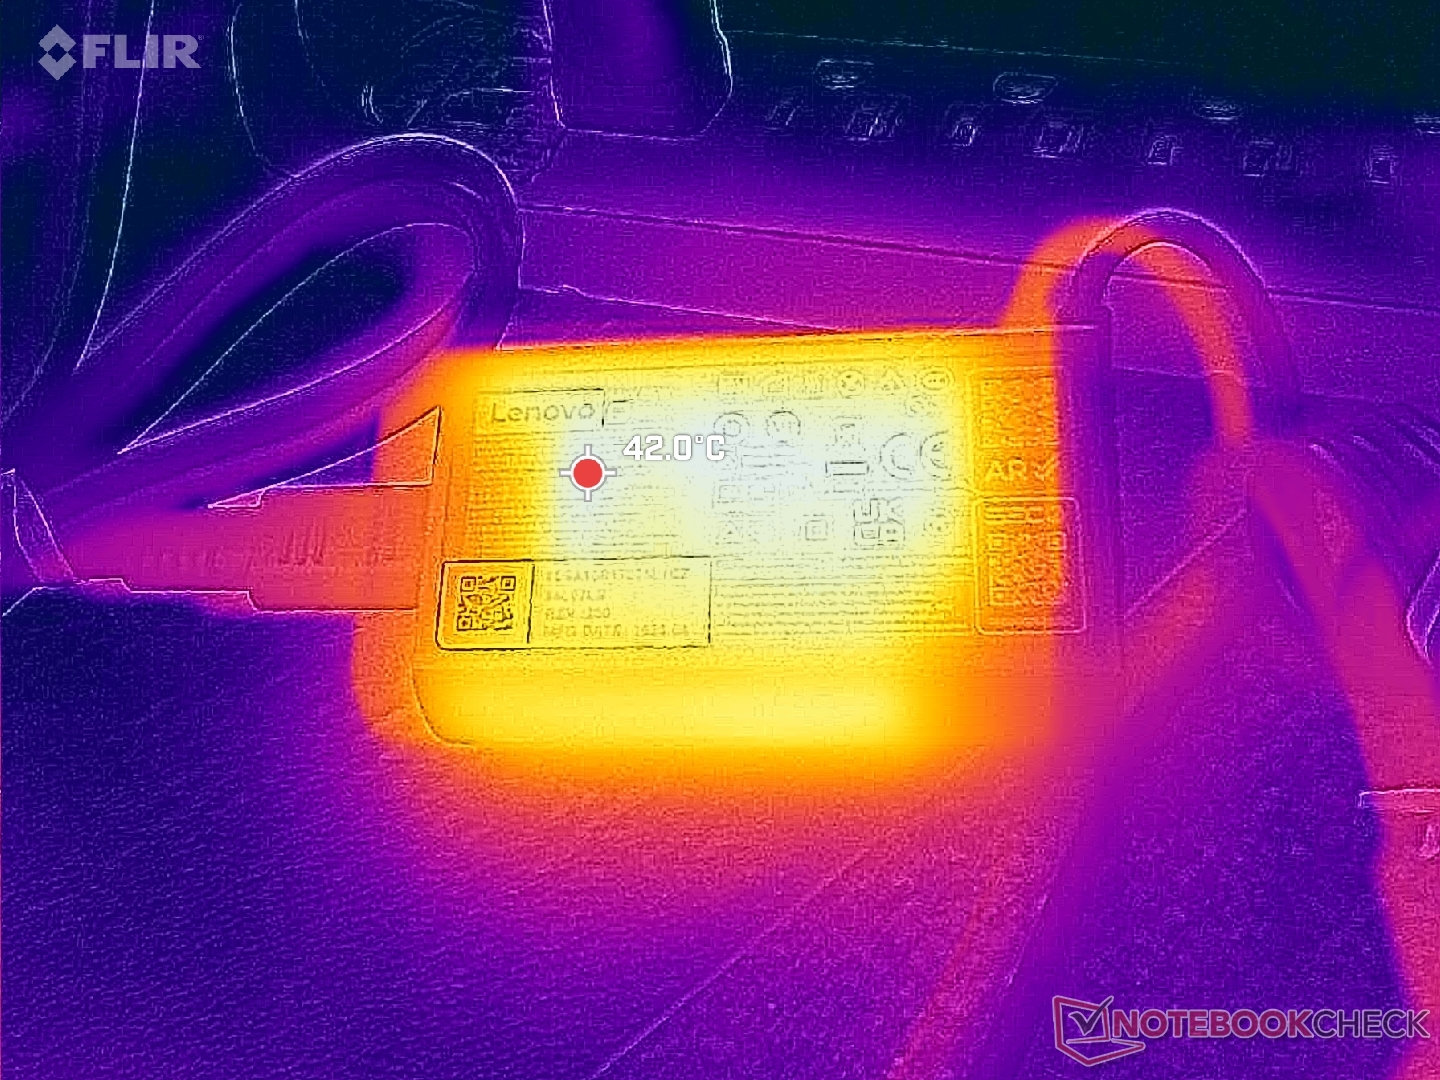
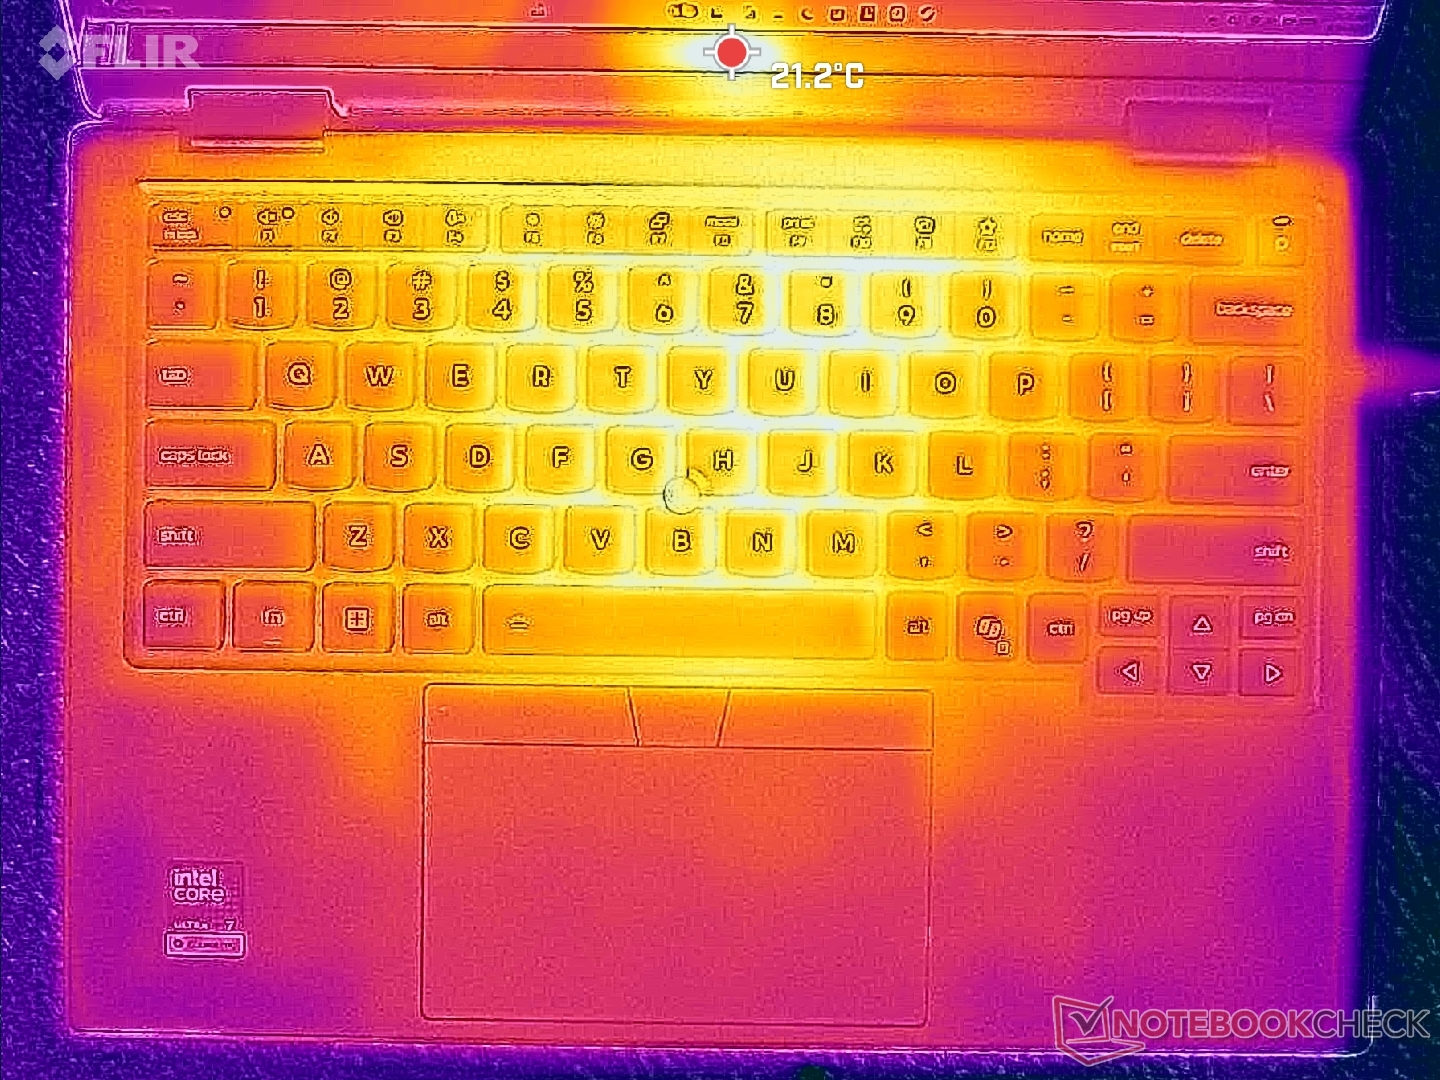
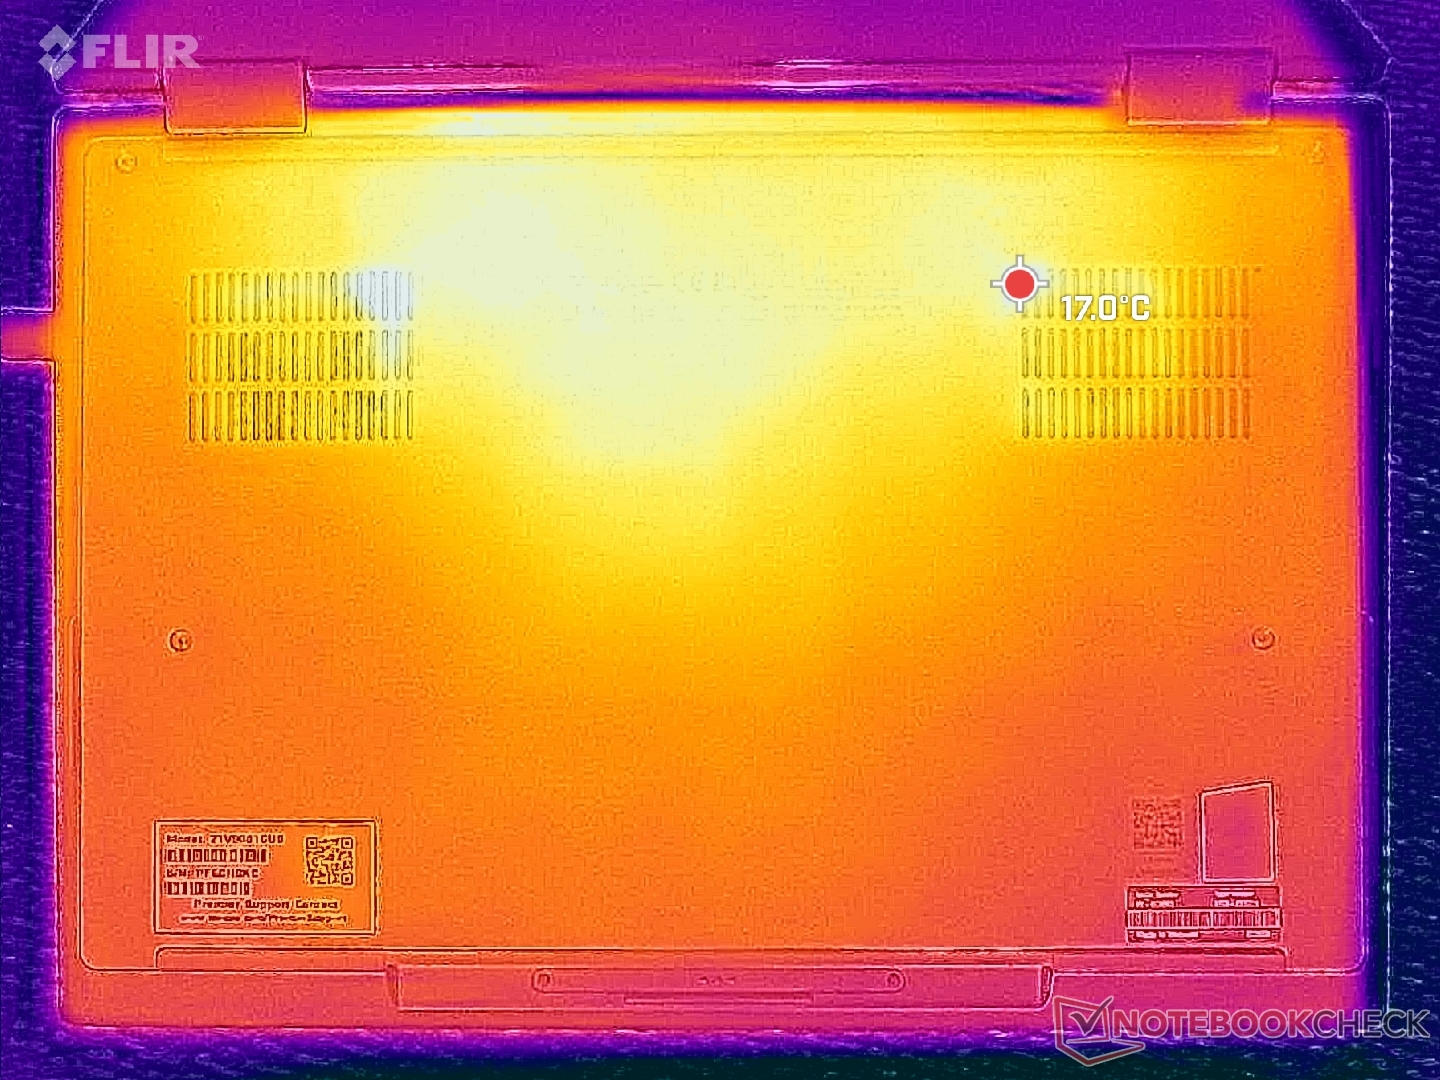
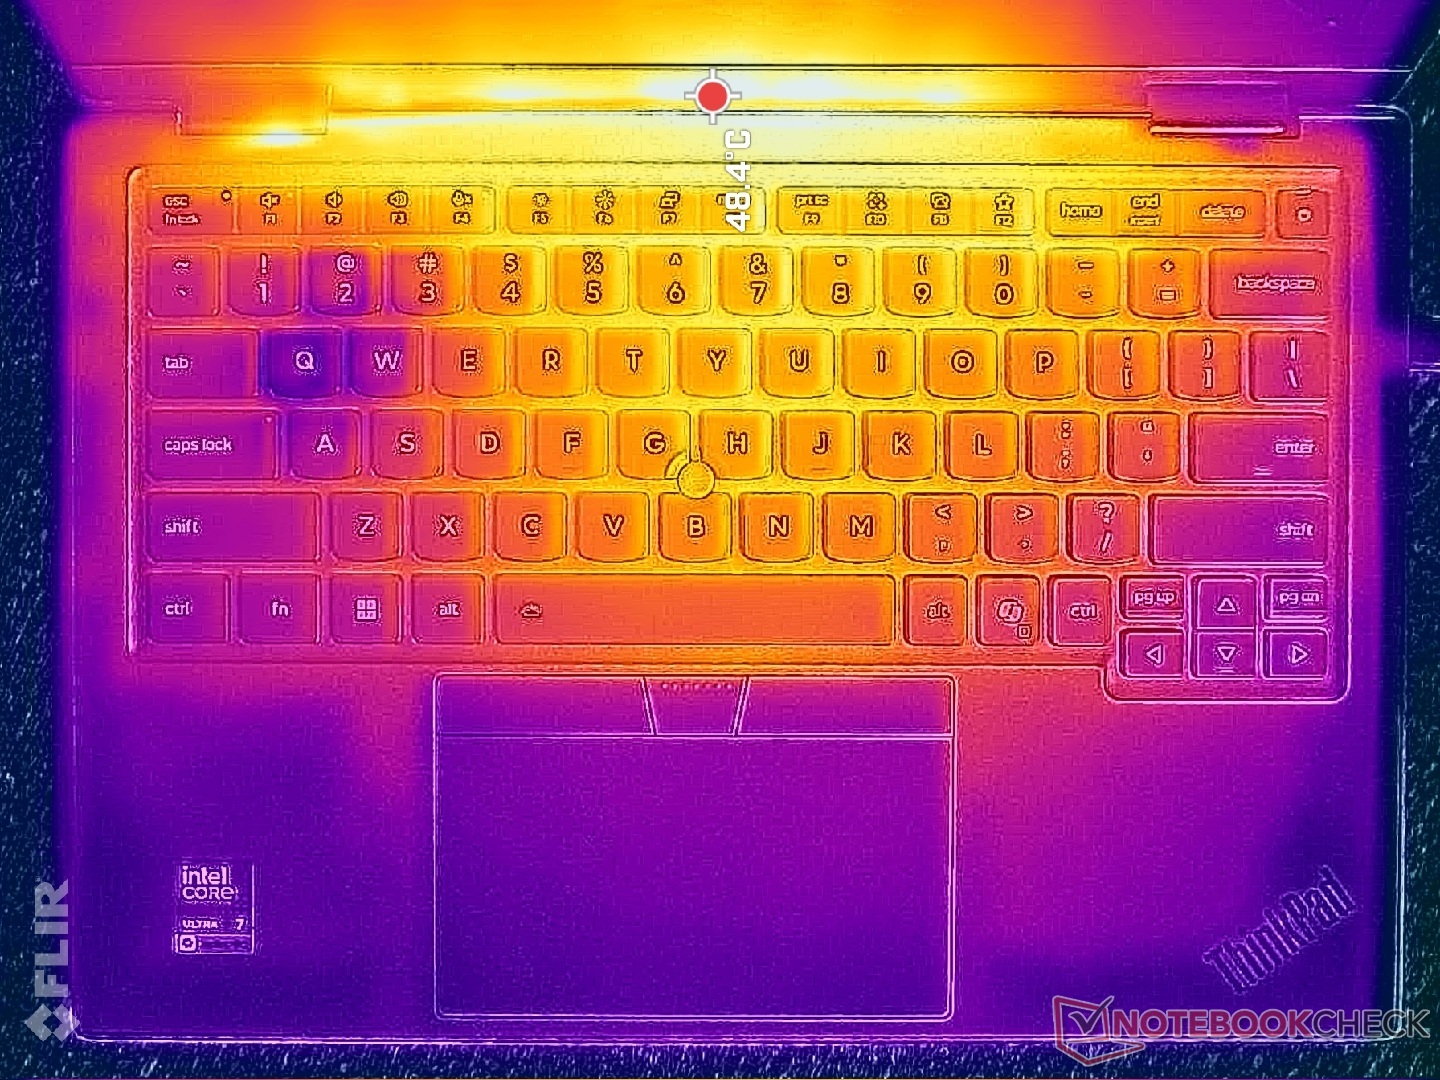
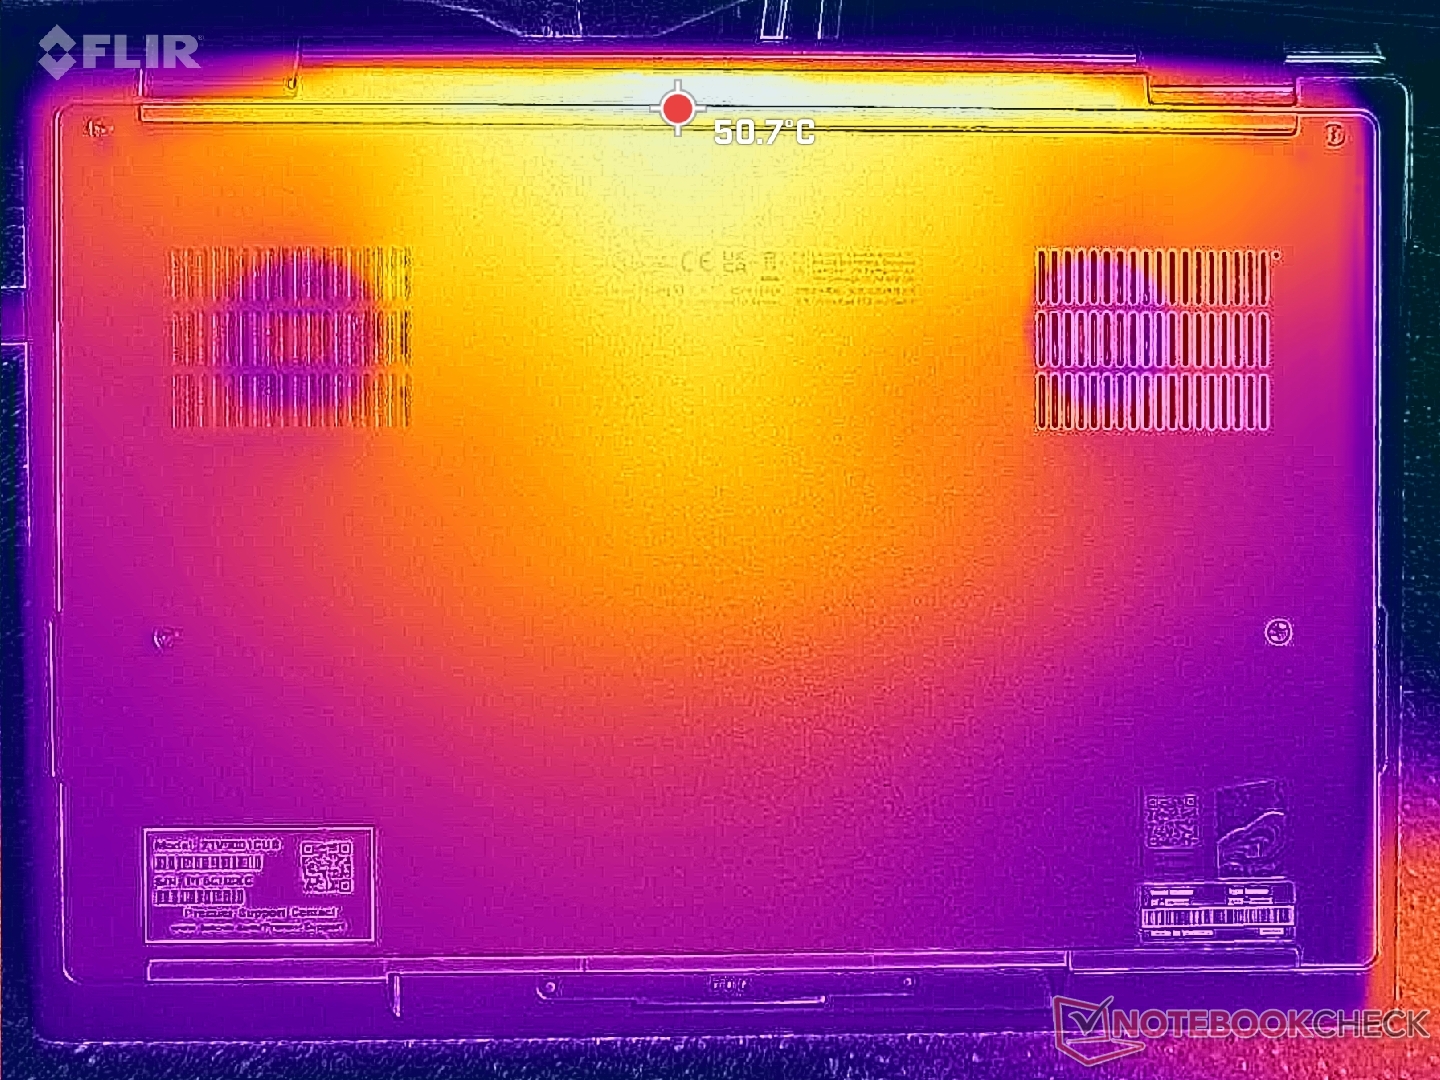
Surface temperatures are again very similar to last year’s model despite the external and internal revisions.
Max. Load
| 33.6 °C 92 F44.2 °C 112 F42.2 °C 108 F 32 °C 90 F40.6 °C 105 F36.6 °C 98 F 23.6 °C 74 F26.6 °C 80 F28 °C 82 F |
| Maximum: 44.2 °C = 112 F Average: 34.2 °C = 94 F |
| 29.4 °C 85 F34.6 °C 94 F34 °C 93 F27.2 °C 81 F32.2 °C 90 F30.6 °C 87 F27 °C 81 F28 °C 82 F27.4 °C 81 F |
| Maximum: 34.6 °C = 94 F Average: 30 °C = 86 F |
Power Supply (max.) 43 °C = 109 F | Room Temperature 20 °C = 68 F | Fluke 62 Mini IR Thermometer
(±) The average temperature for the upper side under maximal load is 34.2 °C / 94 F, compared to the average of 30.3 °C / 87 F for the devices in the class Convertible.
(±) The maximum temperature on the upper side is 44.2 °C / 112 F, compared to the average of 35.4 °C / 96 F, ranging from 19.6 to 60 °C for the class Convertible.
(+) The bottom heats up to a maximum of 34.6 °C / 94 F, compared to the average of 36.9 °C / 98 F
(+) In idle usage, the average temperature for the upper side is 24.7 °C / 76 F, compared to the device average of 30.3 °C / 87 F.
(+) The palmrests and touchpad are cooler than skin temperature with a maximum of 28 °C / 82.4 F and are therefore cool to the touch.
(±) The average temperature of the palmrest area of similar devices was 28 °C / 82.4 F (0 °C / 0 F).
| Lenovo ThinkPad X1 2-in-1 Gen 11 Ultra 7 355, Intel Graphics 4 Xe3 PTL | Lenovo ThinkPad X1 2-in-1 Gen 10 Core Ultra 7 258V, Arc 140V | Lenovo Yoga Book 9 14IAH10 Ultra 7 255H, Arc 140T | HP EliteBook X Flip G1i 14 AI Core Ultra 7 258V, Arc 140V | Dell Latitude 7450 2-in-1 Ultra 7 165U, Graphics 4-Core iGPU (Arrow Lake) | Asus ExpertBook Ultra B9406CAA Ultra X7 358H, Arc B390 Panther Lake iGPU | |
|---|---|---|---|---|---|---|
| Heat | 2% | -11% | 1% | -5% | 4% | |
| Maximum Upper Side * (°C) | 44.2 | 40 10% | 38.2 14% | 36 19% | 41.2 7% | 38.6 13% |
| Maximum Bottom * (°C) | 34.6 | 38.6 -12% | 38.8 -12% | 41 -18% | 45 -30% | 38.4 -11% |
| Idle Upper Side * (°C) | 26.2 | 25 5% | 32.6 -24% | 26 1% | 27.2 -4% | 24.6 6% |
| Idle Bottom * (°C) | 27.8 | 26.6 4% | 33.8 -22% | 27 3% | 26.2 6% | 26 6% |
* … smaller is better
Stress Test
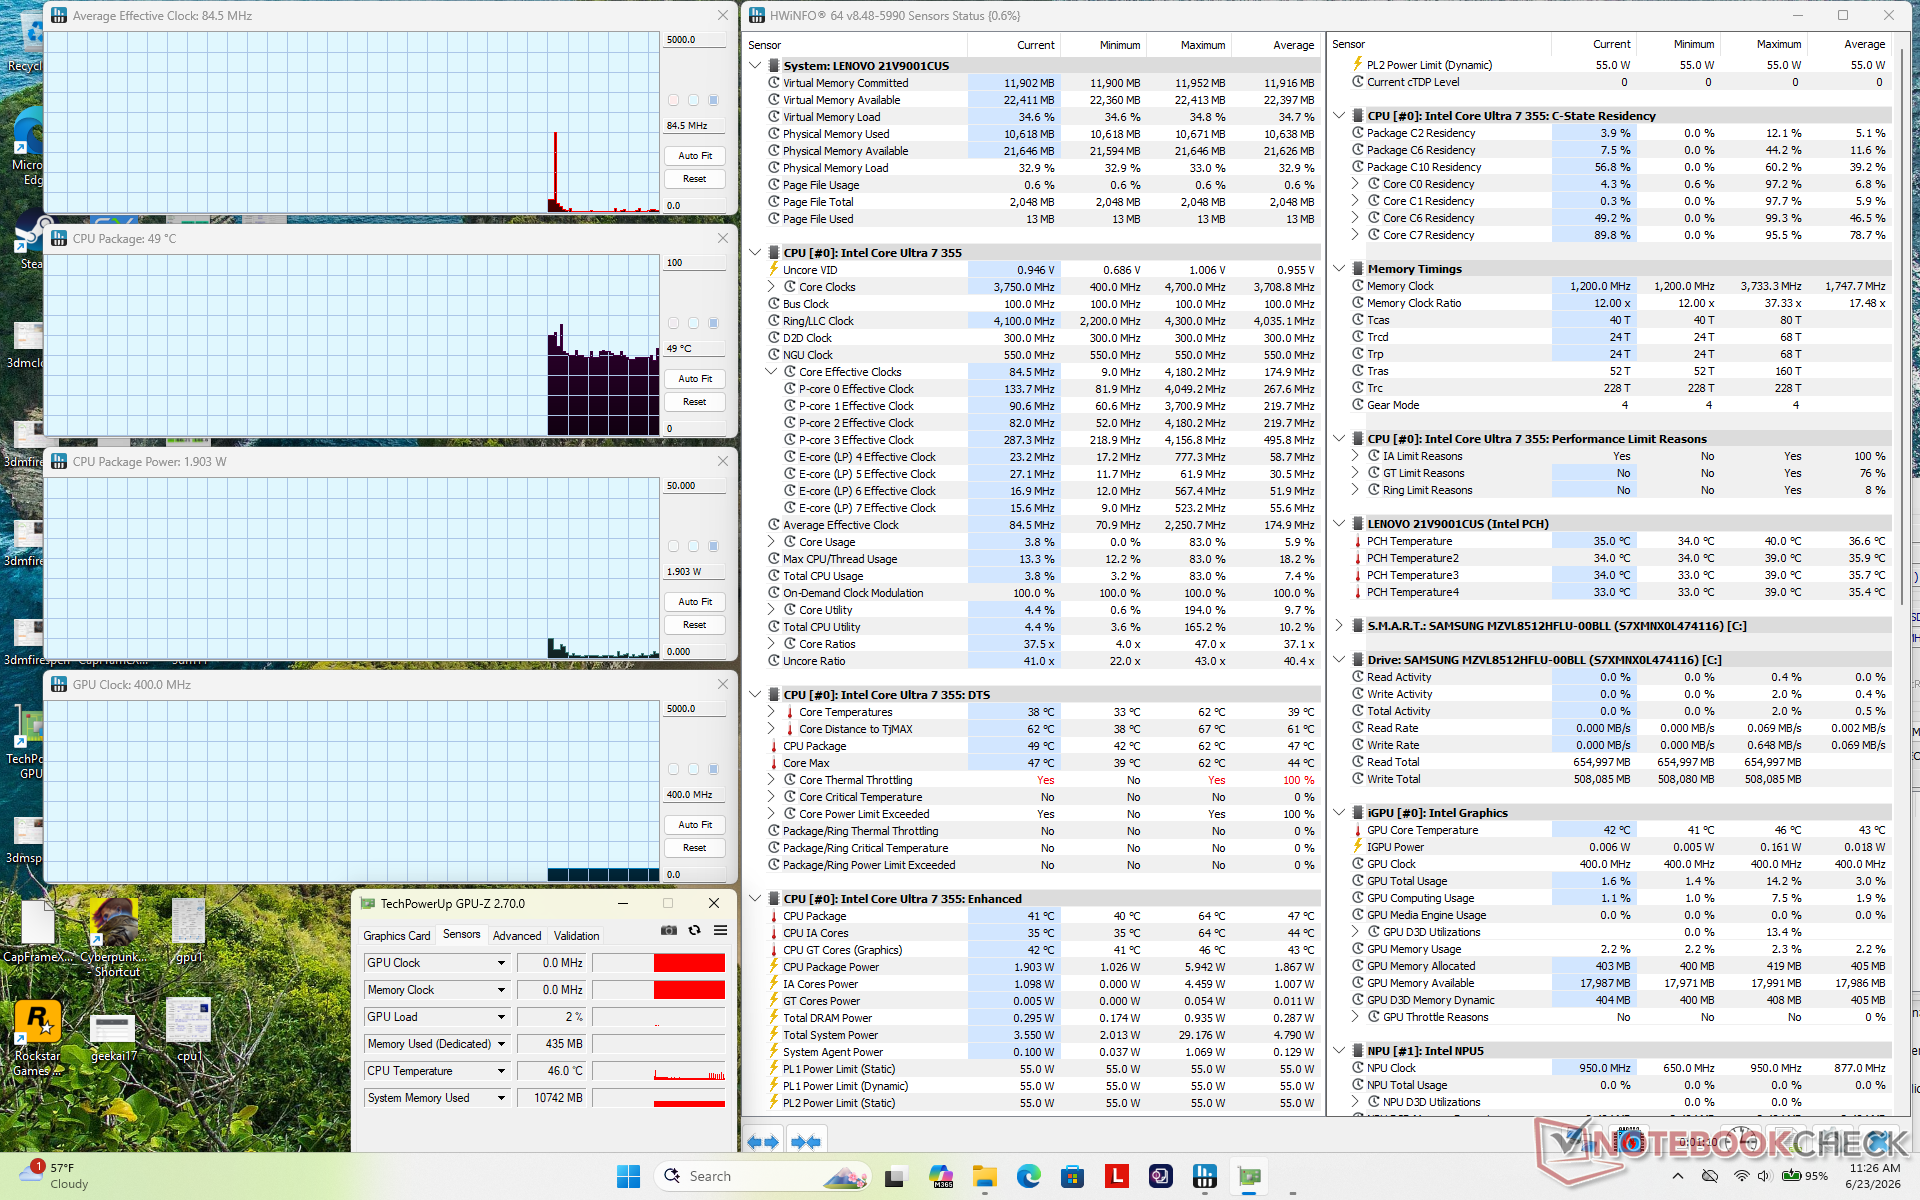
The CPU would boost to 3.7 GHz, 64 W, and 96 C lasting for only a few seconds before falling slightly to 3.5 GHz and 45 W. Core temperature under load would hover in the high 80 C to 90 C range.
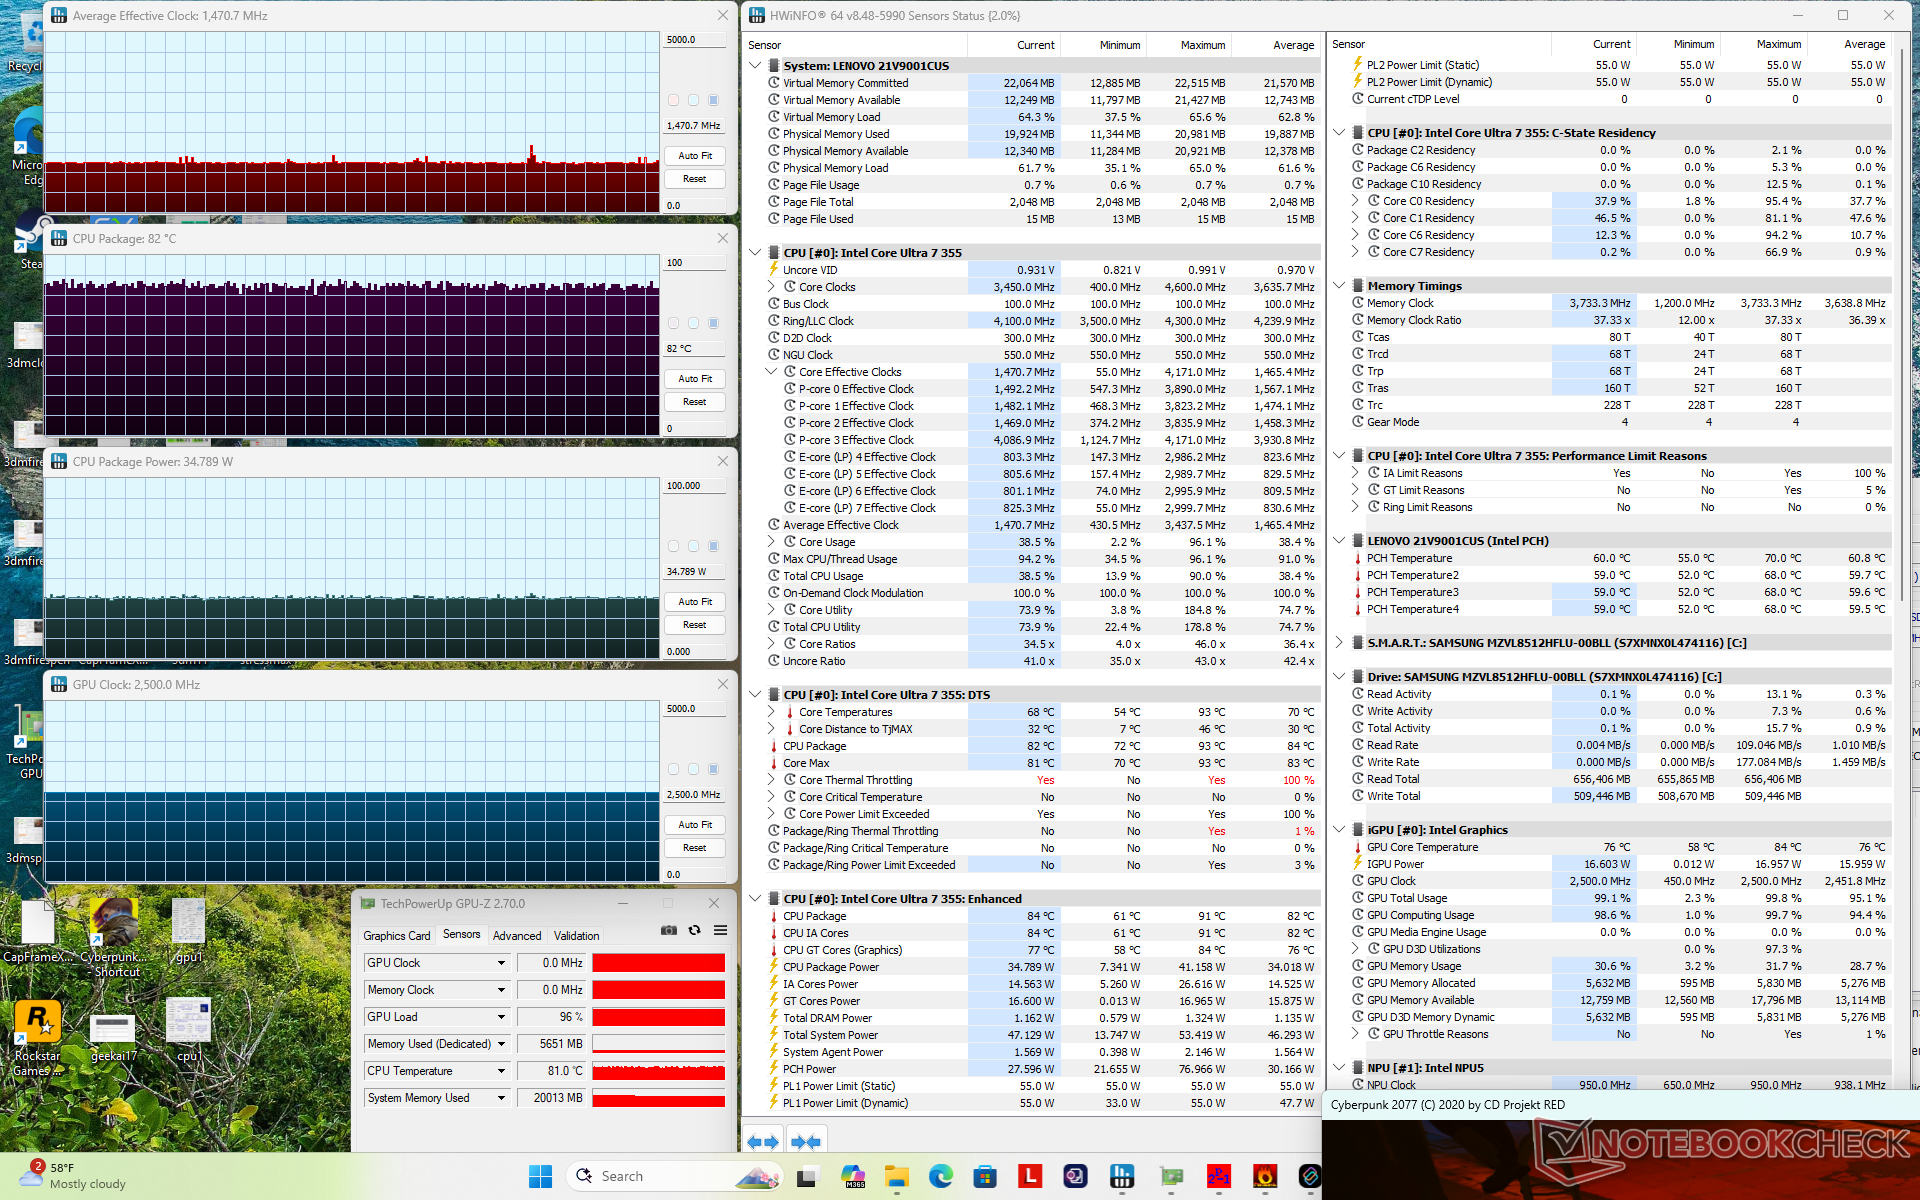
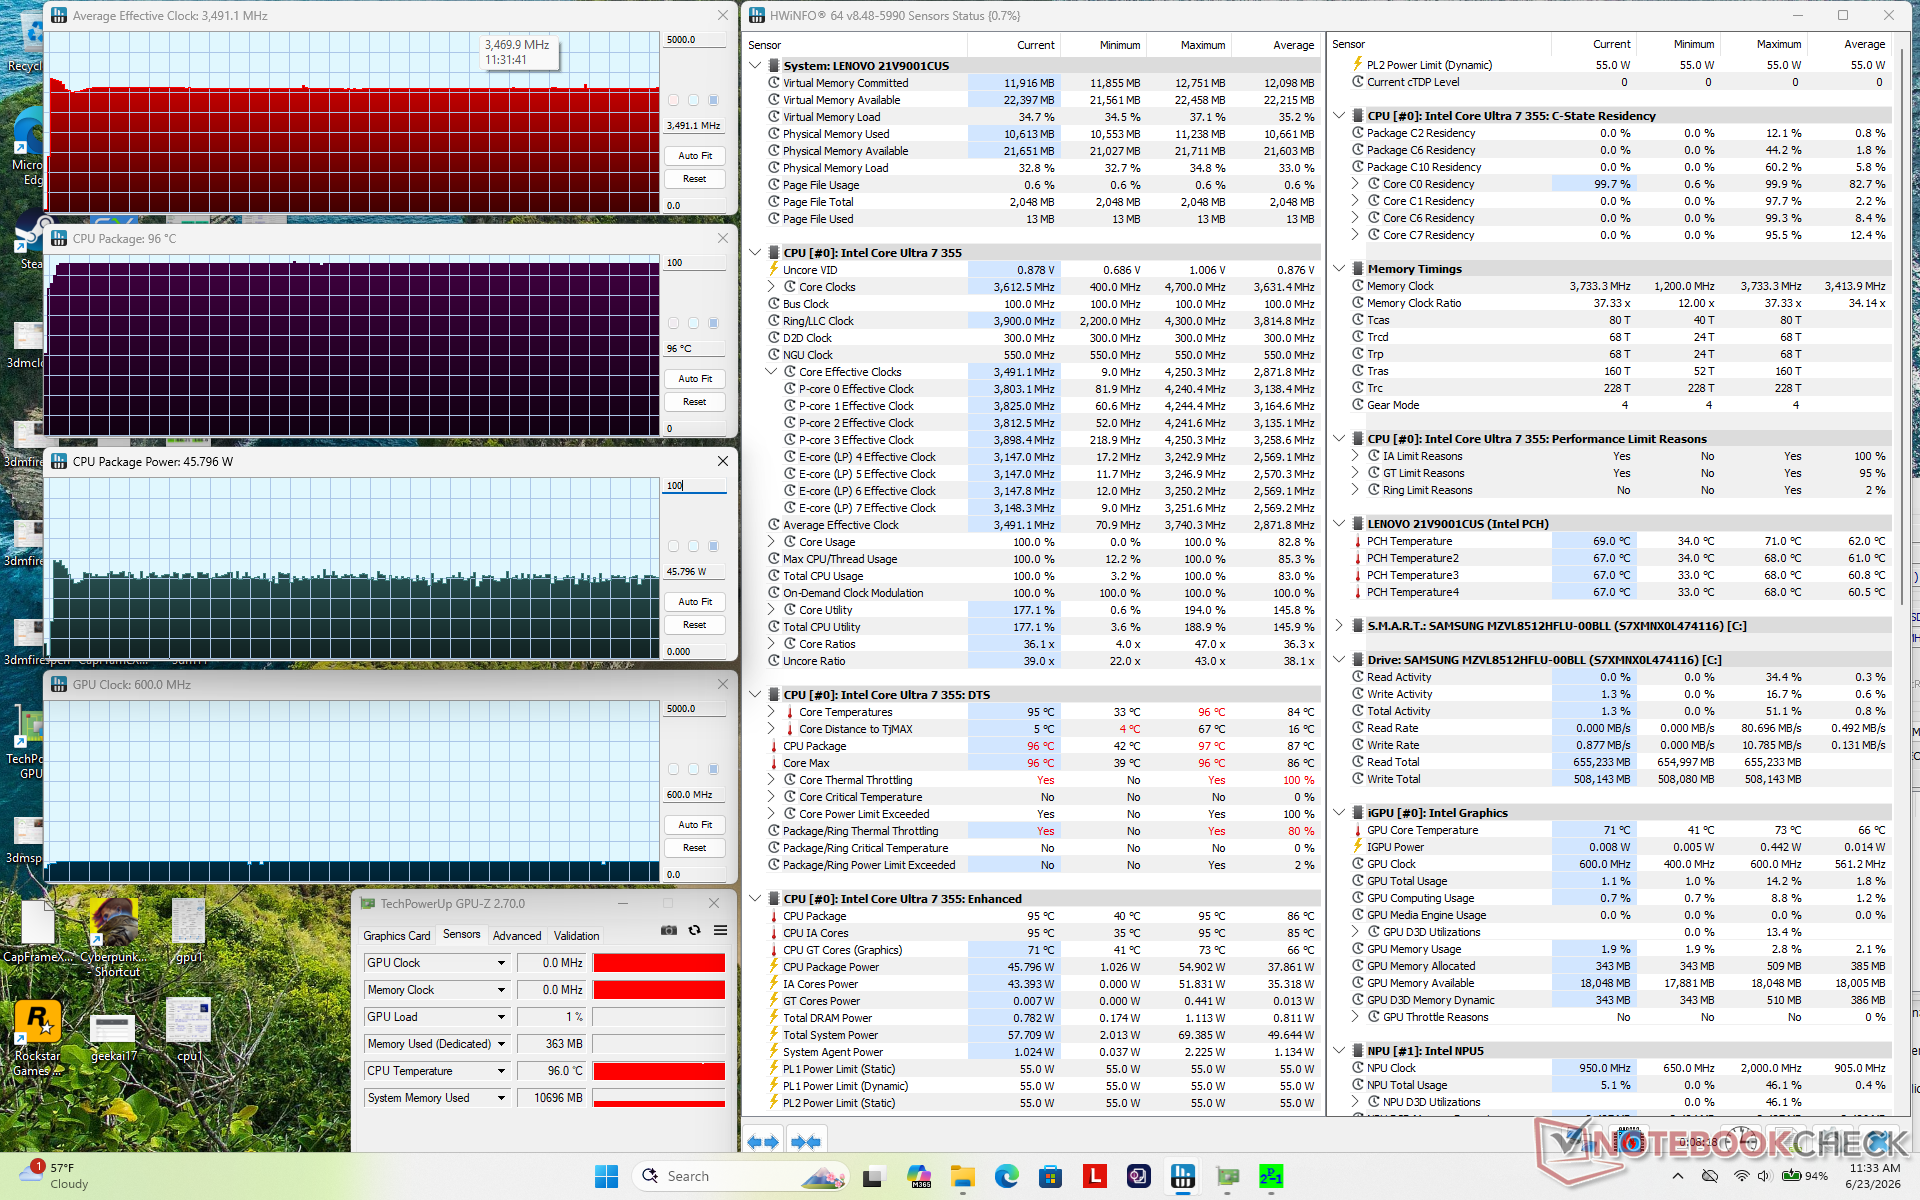
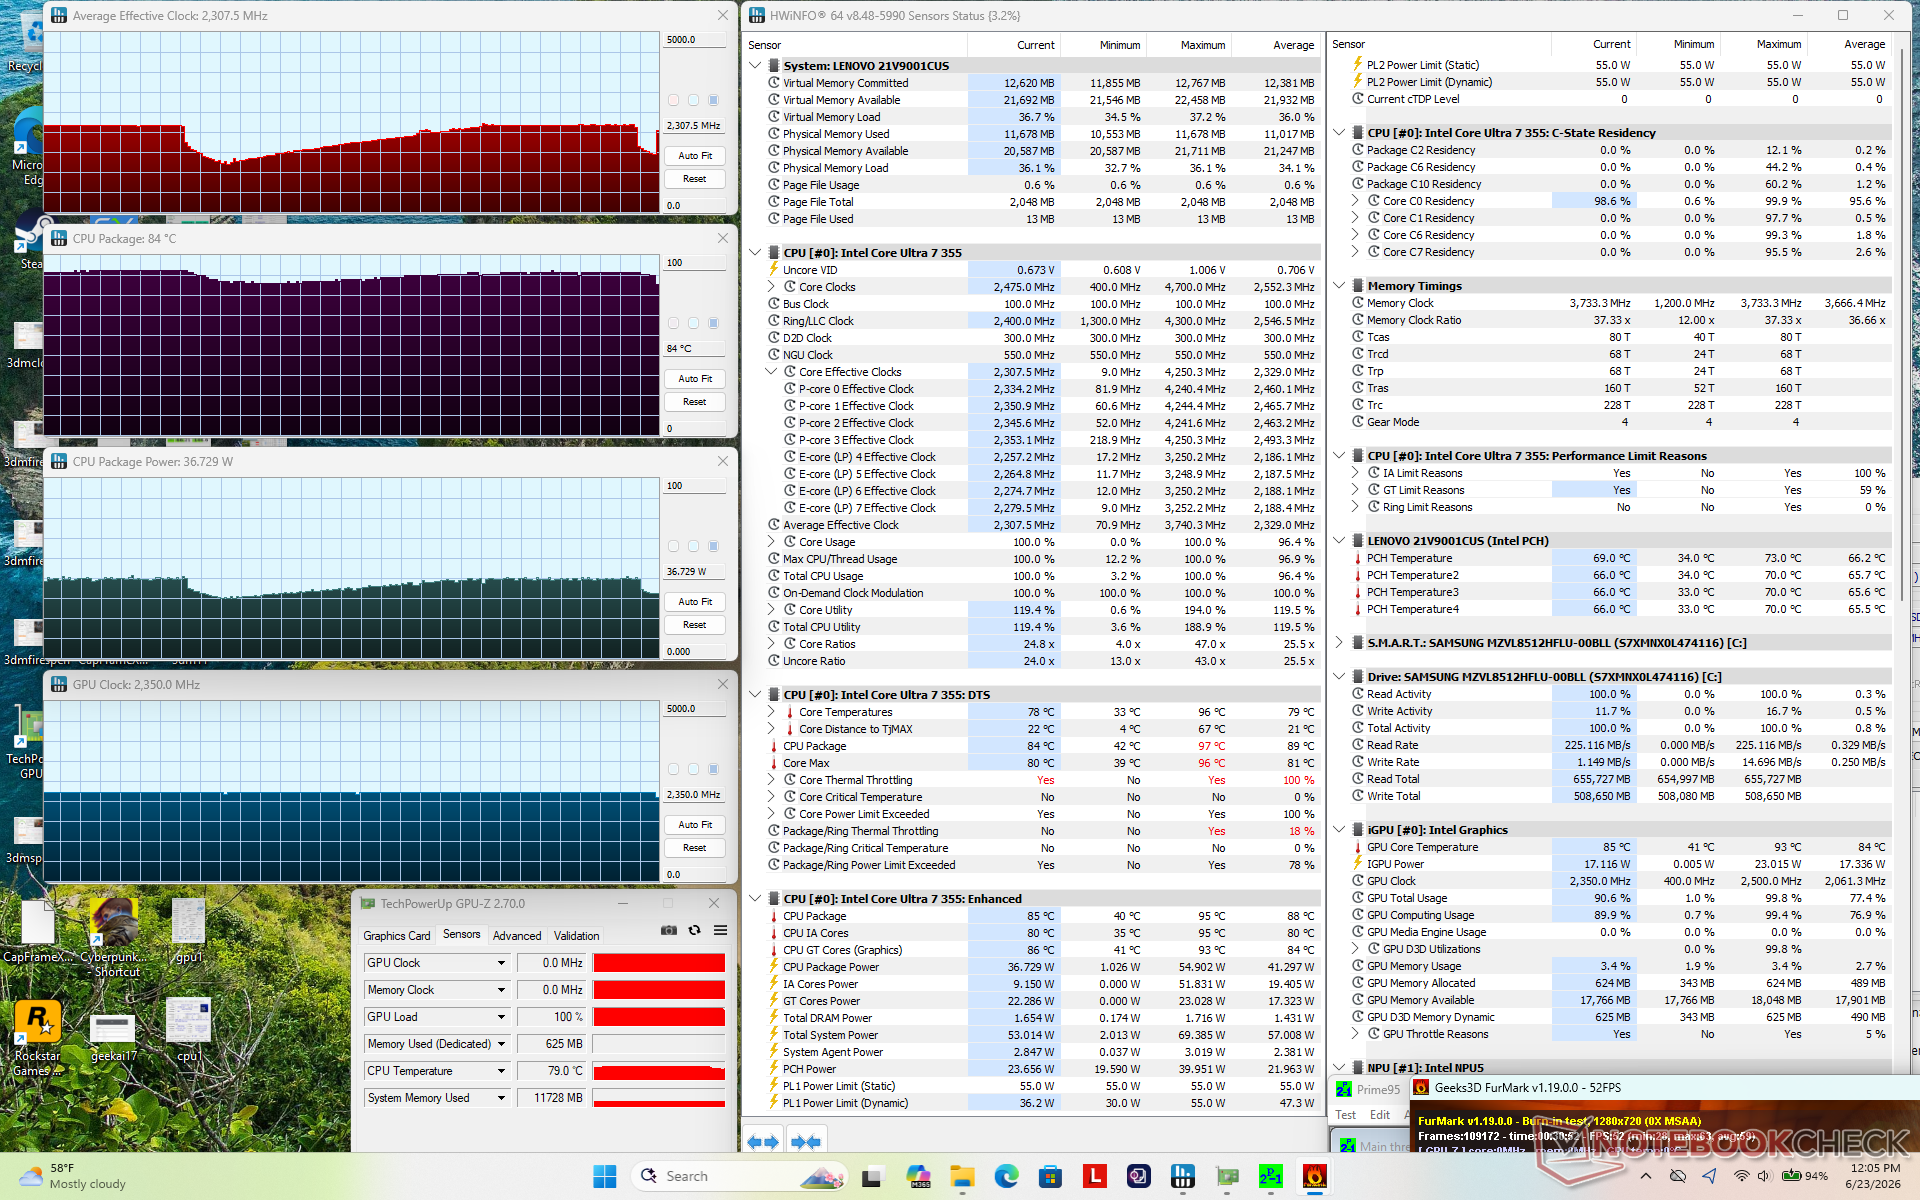
| Average CPU Clock (GHz) | GPU Clock (MHz) | Average CPU Temperature (°C) | |
| System Idle | — | — | 49 |
| Prime95 Stress | 3.5 | — | 96 |
| Prime95 + FurMark Stress | 1.4 – 2.5 | 2500 | 84 – 91 |
| Cyberpunk 2077 Stress | 1.5 | 2500 | 82 |
Speakers
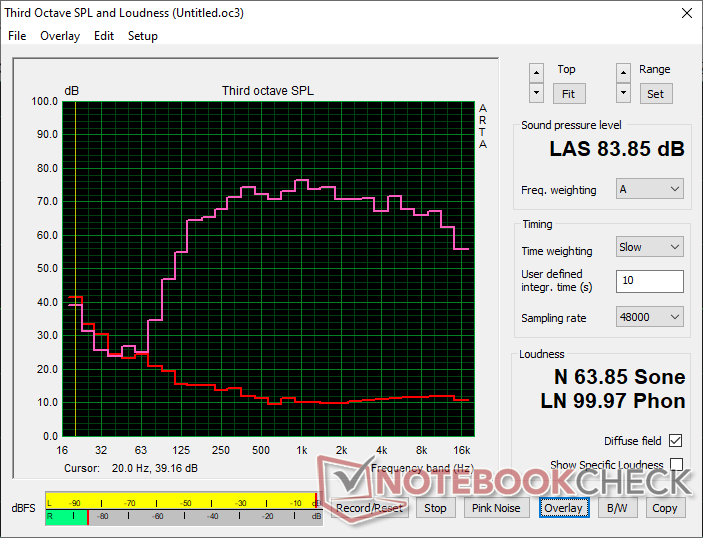
dB(A)0102030405060708090Deep BassMiddle BassHigh BassLower RangeMidsHigher MidsLower HighsMid HighsUpper HighsSuper Highs2041.539.22533.531.43130.625.64024.4245023.326.86324.525.28020.934.610019.446.712515.554.916015.464.620015.265.425013.867.931514.371.340012.174.350011.472.36309.770.980011.473.3100010.376.5125010.173.616009.974.420001070.8250010.370.8315010.670.9400011.267.2500011.371.8630011.767.8800011.6661000011.967.2125001262.31600010.955.8SPL23.283.9N0.563.9median 11.4median 70.8Delta1.73.826.325.821.422.12624.925.127.622.532.523.448.72655.818.860.922.167.2267019.372.317.674.217.774.319.575.31571.711.871.311.27410.574.21072.710.17210.67210.97511.374.811.671.71269.71269.612.371.112.669.61270.111.269.824.784.70.666.6median 12median 71.73.42.2hearing rangehide medianPink NoiseLenovo ThinkPad X1 2-in-1 Gen 11Apple MacBook Pro 16 2021 M1 Pro
Frequency diagram (checkboxes can be checked and unchecked to compare devices)
Lenovo ThinkPad X1 2-in-1 Gen 11 audio analysis
(+) | speakers can play relatively loud (83.9 dB)
Bass 100 – 315 Hz
(±) | reduced bass – on average 9.2% lower than median
(±) | linearity of bass is average (10.3% delta to prev. frequency)
Mids 400 – 2000 Hz
(+) | balanced mids – only 2.5% away from median
(+) | mids are linear (4.1% delta to prev. frequency)
Highs 2 – 16 kHz
(+) | balanced highs – only 2.3% away from median
(+) | highs are linear (3.7% delta to prev. frequency)
Overall 100 – 16.000 Hz
(+) | overall sound is linear (9% difference to median)
Compared to same class
» 4% of all tested devices in this class were better, 1% similar, 95% worse
» The best had a delta of 6%, average was 20%, worst was 57%
Compared to all devices tested
» 3% of all tested devices were better, 1% similar, 96% worse
» The best had a delta of 4%, average was 23%, worst was 134%
Apple MacBook Pro 16 2021 M1 Pro audio analysis
(+) | speakers can play relatively loud (84.7 dB)
Bass 100 – 315 Hz
(+) | good bass – only 3.8% away from median
(+) | bass is linear (5.2% delta to prev. frequency)
Mids 400 – 2000 Hz
(+) | balanced mids – only 1.3% away from median
(+) | mids are linear (2.1% delta to prev. frequency)
Highs 2 – 16 kHz
(+) | balanced highs – only 1.9% away from median
(+) | highs are linear (2.7% delta to prev. frequency)
Overall 100 – 16.000 Hz
(+) | overall sound is linear (4.6% difference to median)
Compared to same class
» 0% of all tested devices in this class were better, 0% similar, 100% worse
» The best had a delta of 5%, average was 17%, worst was 45%
Compared to all devices tested
» 0% of all tested devices were better, 0% similar, 100% worse
» The best had a delta of 4%, average was 23%, worst was 134%
Energy Management
Power Consumption
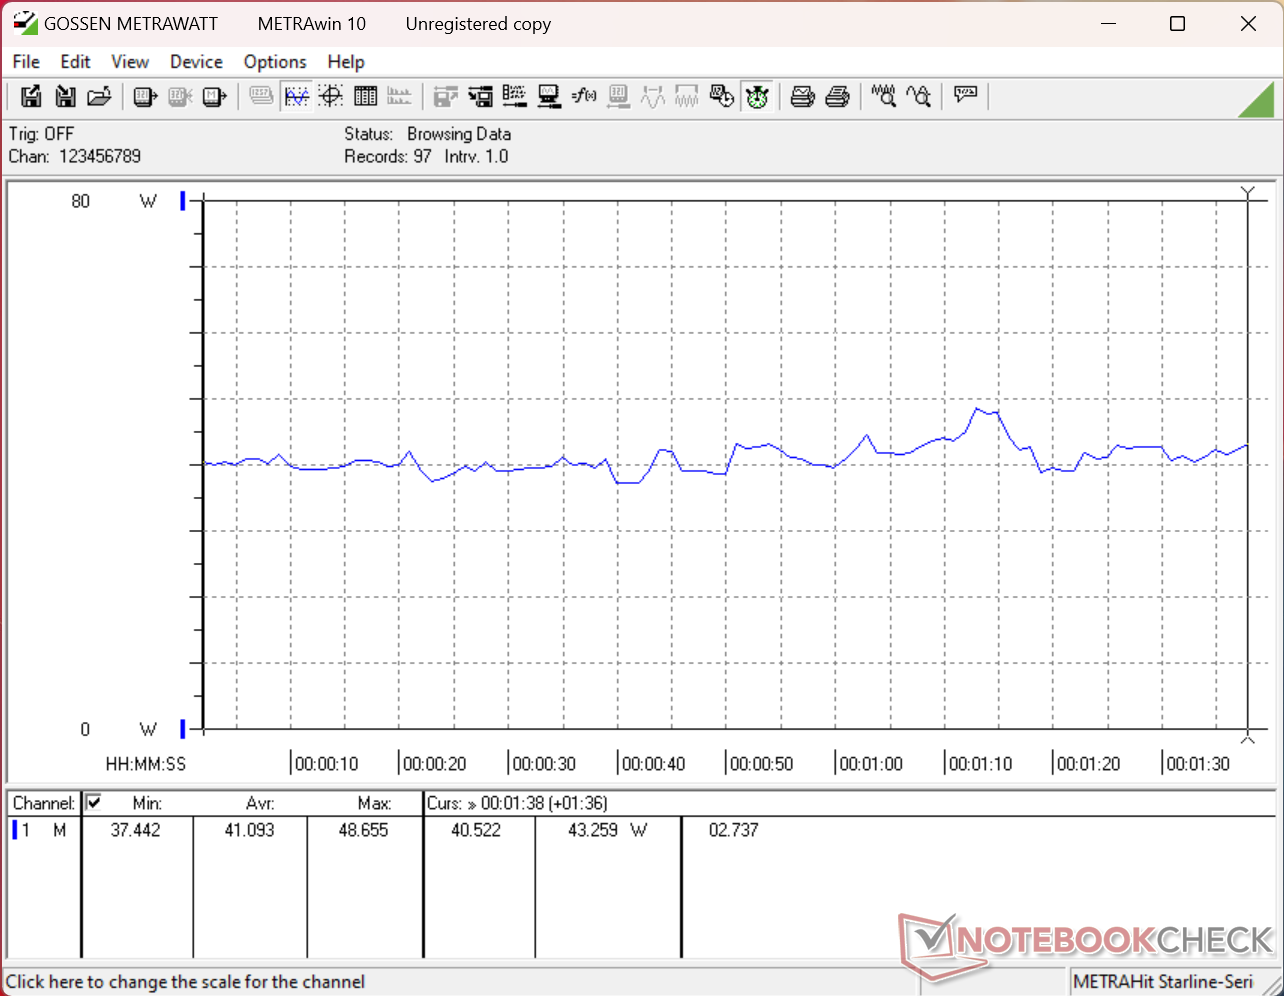
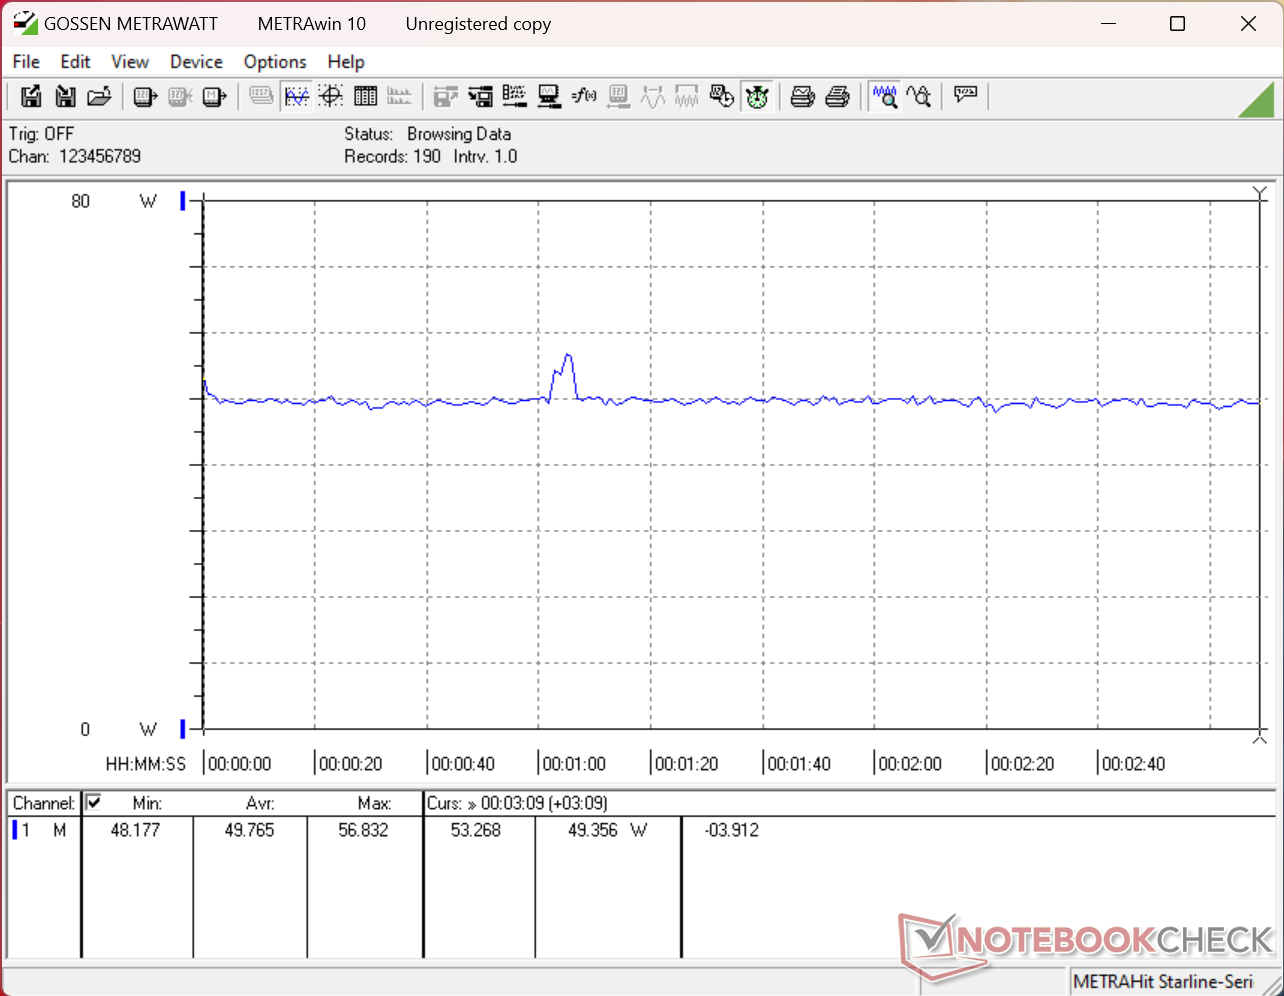
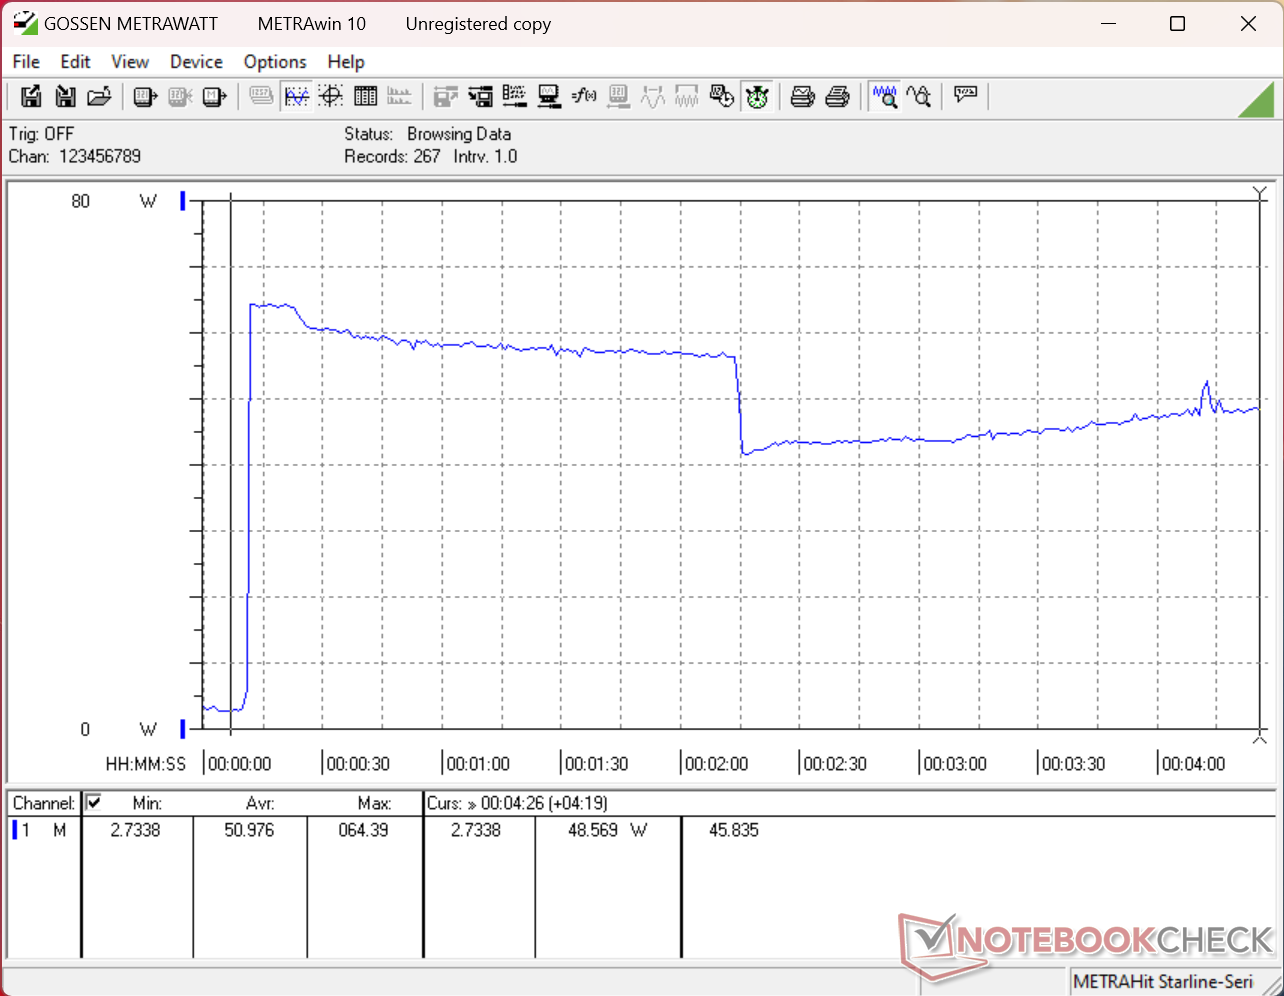
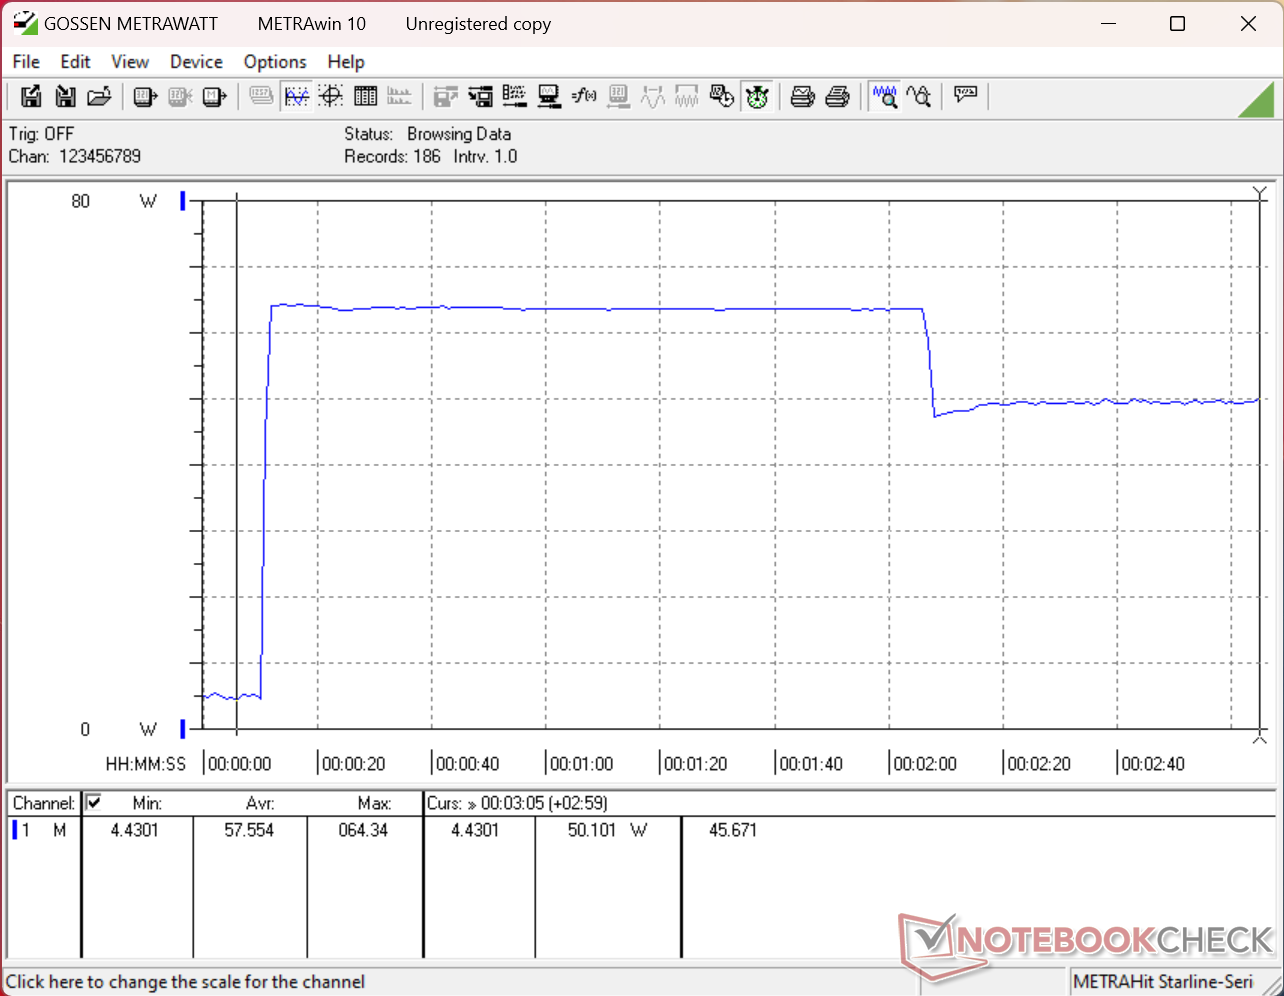
Power consumption under load is more demanding albeit steadier than what we recorded on last year’s model which correlates with the faster and steadier CPU and GPU results noted above. Average consumption is nevertheless quite similar when running undemanding loads for similar WLAN runtimes.
Power Consumption
| Off / Standby | 0.2 / 0.58 Watt |
| Idle | 1.9 / 4.7 / 5 Watt |
| Load | 41 / 64.3 Watt |
    | |
| Key: min: , med: , max: Metrahit Energy | |
| Lenovo ThinkPad X1 2-in-1 Gen 11 Ultra 7 355, Intel Graphics 4 Xe3 PTL, Samsung PM9C1b MZVL8512HFLU-00BLL, IPS, 1920×1200, 14″ | Lenovo ThinkPad X1 2-in-1 Gen 10 Core Ultra 7 258V, Arc 140V, , IPS, 1920×1200, 14″ | Lenovo Yoga Book 9 14IAH10 Ultra 7 255H, Arc 140T, Samsung PM9C1a MZAL81T0HDLB, OLED, 2880×1800, 14″ | HP EliteBook X Flip G1i 14 AI Core Ultra 7 258V, Arc 140V, Western Digital PC SN5000S SDEPNSJ-1T00-1006, IPS, 1920×1200, 14″ | Dell Latitude 7450 2-in-1 Ultra 7 165U, Graphics 4-Core iGPU (Arrow Lake), Micron 2550 512GB, IPS, 1920×1200, 14″ | Asus ExpertBook Ultra B9406CAA Ultra X7 358H, Arc B390 Panther Lake iGPU, Samsung PM9E1 MZVLC2T0HBLD, OLED, 2880×1800, 14″ | |
|---|---|---|---|---|---|---|
| Power Consumption | 5% | -146% | -24% | -5% | -19% | |
| Idle Minimum * (Watt) | 1.9 | 1.5 21% | 9.9 -421% | 2.9 -53% | 2.23 -17% | 3.5 -84% |
| Idle Average * (Watt) | 4.7 | 4.8 -2% | 11.6 -147% | 8.2 -74% | 5.36 -14% | 4 15% |
| Idle Maximum * (Watt) | 5 | 5 -0% | 23.2 -364% | 8.6 -72% | 6.8 -36% | 5.3 -6% |
| Load Average * (Watt) | 41 | 44.2 -8% | 58.5 -43% | 39.6 3% | 51.2 -25% | 43.7 -7% |
| Cyberpunk 2077 ultra * (Watt) | 49.8 | 47.8 4% | 58.5 -17% | 41.9 16% | 29.5 41% | 61.3 -23% |
| Cyberpunk 2077 ultra external monitor * (Watt) | 47.4 | 39.3 17% | 56.6 -19% | 36.4 23% | 34.6 27% | 61.4 -30% |
| Load Maximum * (Watt) | 64.3 | 60.2 6% | 70.1 -9% | 70 -9% | 69.9 -9% | 63.4 1% |
* … smaller is better
Power Consumption Cyberpunk / Stress Test
05101520253035404550556063.7602.92.2149.752 Watt Lenovo ThinkPad X1 2-in-1 Gen 10
Lenovo ThinkPad X1 2-in-1 Gen 11 Ultra 7 355, Intel Graphics 4 Xe3 PTL; 1280×720 Prime95 28.10 and Furmark 1.25: Ø59 (47.3-64.3) Watt
Lenovo ThinkPad X1 2-in-1 Gen 10 Core Ultra 7 258V, Arc 140V; 1280×720 Prime95 28.10 and Furmark 1.25: Ø48.4 (34.2-60.2) Watt
Lenovo ThinkPad X1 2-in-1 Gen 11 Ultra 7 355, Intel Graphics 4 Xe3 PTL; Idle 150cd/m2: Ø2.59 (2.22-3.88) Watt
Lenovo ThinkPad X1 2-in-1 Gen 10 Core Ultra 7 258V, Arc 140V; Idle 150cd/m2: Ø2.31 (2.15-3.27) Watt
Lenovo ThinkPad X1 2-in-1 Gen 11 Ultra 7 355, Intel Graphics 4 Xe3 PTL; Cyberpunk 2077 FHD ultra no FSR 150cd: Ø49.8 (48.2-56.8) Watt
Lenovo ThinkPad X1 2-in-1 Gen 10 Core Ultra 7 258V, Arc 140V; Cyberpunk 2077 FHD ultra no FSR 150cd: Ø47.8 (34.2-59.1) Watt
Power Consumption external Monitor
05101520253035404550556060.556.454.949.945.238.62.87 Watt Lenovo ThinkPad X1 2-in-1 Gen 111.34547.535
Lenovo ThinkPad X1 2-in-1 Gen 11 Ultra 7 355, Intel Graphics 4 Xe3 PTL; Prime95 V2810 Stress (external Monitor): Ø51.8 (41.7-64.4) Watt
Lenovo ThinkPad X1 2-in-1 Gen 10 Core Ultra 7 258V, Arc 140V; Prime95 V2810 Stress (external Monitor): Ø39.6 (31.2-56.9) Watt
Lenovo ThinkPad X1 2-in-1 Gen 11 Ultra 7 355, Intel Graphics 4 Xe3 PTL; Cinebench R15 Multi (external Monitor): Ø55.2 (51-62.3) Watt
Lenovo ThinkPad X1 2-in-1 Gen 10 Core Ultra 7 258V, Arc 140V; Cinebench R15 Multi (external Monitor): Ø54.1 (47.1-55.2) Watt
Lenovo ThinkPad X1 2-in-1 Gen 11 Ultra 7 355, Intel Graphics 4 Xe3 PTL; Cinebench R23 Multi (external Monitor): Ø51.1 (49.1-58.8) Watt
Lenovo ThinkPad X1 2-in-1 Gen 11 Ultra 7 355, Intel Graphics 4 Xe3 PTL; 1280×720 FurMark 1.19 GPU Stress Test (external Monitor): Ø46.2 (38.6-55.7) Watt
Lenovo ThinkPad X1 2-in-1 Gen 10 Core Ultra 7 258V, Arc 140V; 1280×720 FurMark 1.19 GPU Stress Test (external Monitor): Ø39.1 (37.8-45.6) Watt
Lenovo ThinkPad X1 2-in-1 Gen 11 Ultra 7 355, Intel Graphics 4 Xe3 PTL; Idle 1min (external Monitor): Ø1.905 (1.551-2.87) Watt
Lenovo ThinkPad X1 2-in-1 Gen 10 Core Ultra 7 258V, Arc 140V; Idle 1min (external Monitor): Ø1.484 (1.234-3.34) Watt
Lenovo ThinkPad X1 2-in-1 Gen 11 Ultra 7 355, Intel Graphics 4 Xe3 PTL; Cyberpunk 2077 FHD ultra no FSR (external Monitor): Ø47.4 (46.5-55.5) Watt
Lenovo ThinkPad X1 2-in-1 Gen 10 Core Ultra 7 258V, Arc 140V; Cyberpunk 2077 FHD ultra no FSR (external Monitor): Ø39.3 (24.2-53.8) Watt
Battery Life
Battery Runtime
| WiFi Websurfing | 21h 56min | |
| Lenovo ThinkPad X1 2-in-1 Gen 11 Ultra 7 355, Intel Graphics 4 Xe3 PTL, 58 Wh | Lenovo ThinkPad X1 2-in-1 Gen 10 Core Ultra 7 258V, Arc 140V, 57 Wh | Lenovo Yoga Book 9 14IAH10 Ultra 7 255H, Arc 140T, 88 Wh | HP EliteBook X Flip G1i 14 AI Core Ultra 7 258V, Arc 140V, 68 Wh | Dell Latitude 7450 2-in-1 Ultra 7 165U, Graphics 4-Core iGPU (Arrow Lake), 57 Wh | Asus ExpertBook Ultra B9406CAA Ultra X7 358H, Arc B390 Panther Lake iGPU, 70 Wh | |
|---|---|---|---|---|---|---|
| Battery runtime | 0% | -72% | -16% | -50% | -26% | |
| WiFi v1.3 (h) | 21.9 | 22 0% | 6.1 -72% | 18.4 -16% | 11 -50% | 16.1 -26% |
| H.264 (h) | 20.6 | 12.4 | ||||
| Load (h) | 2.1 |
Notebookcheck Rating
The redesigned Thinkpad X1 2-in-1 Gen 11 is aesthetically more professional and can be much faster than before depending on the configuration. However, the thin pen is less than ideal from an ergonomic perspective.
Lenovo ThinkPad X1 2-in-1 Gen 11 – 06/27/2026 v8
Allen Ngo
Chassis
91 / 98 → 93%
Keyboard
89%
Pointing Device
97%
Connectivity
73 / 74 → 98%
Weight
71 / 20-75 → 93%
Battery
93%
Display
80%
Games Performance
49 / 65 → 76%
Application Performance
85 / 92 → 93%
AI Performance
90%
Temperature
92%
Noise
90%
Audio
85 / 91 → 94%
Camera
40 / 75 → 53%
Average
71%
90%
Convertible – Weighted Average
CO2 Emissions
No Data
Materials
50%
Packaging
100%
Power Use
89.4%
Repairability
50%
Software Updates
22.3%
 Total Sustainability Score: 52%
Potential Competitors in Comparison
| Image | Model / Review | Price | Weight | Height | Display |
|---|---|---|---|---|---|
| 1.89.5% | Lenovo ThinkPad X1 2-in-1 Gen 11 Intel Core Ultra 7 355 ⎘ Intel Graphics 4 Xe3 Panther Lake iGPU ⎘ 32 GB Memory, 512 GB SSD | Amazon: List Price: 2700 USD | 1.3 kg | 17.9 mm | 14.00″ 1920×1200 162 PPI IPS |
| 2.88.8% | Lenovo ThinkPad X1 2-in-1 Gen 10 Intel Core Ultra 7 258V ⎘ Intel Arc Graphics 140V ⎘ 32 GB Memory | Amazon: List Price: 2300 USD | 1.4 kg | 18.3 mm | 14.00″ 1920×1200 162 PPI IPS |
| 3.83.4% | Lenovo Yoga Book 9 14IAH10 Intel Core Ultra 7 255H ⎘ Intel Arc Graphics 140T ⎘ 16 GB Memory, 1024 GB SSD | Amazon: | 1.2 kg | 15.5 mm | 14.00″ 2880×1800 243 PPI OLED |
| 4.89.9% | HP EliteBook X Flip G1i 14 AI Intel Core Ultra 7 258V ⎘ Intel Arc Graphics 140V ⎘ 32 GB Memory, 1000 GB SSD | Amazon: List Price: 2889 Euro | 1.5 kg | 14.7 mm | 14.00″ 1920×1200 162 PPI IPS |
| 5.87.7% | Dell Latitude 7450 2-in-1 Intel Core Ultra 7 165U ⎘ Intel Graphics 4-Core iGPU (Meteor / Arrow Lake) ⎘ 32 GB Memory, 512 GB SSD | Amazon: $1,019.95 List Price: 2279 USD | 1.5 kg | 17.1 mm | 14.00″ 1920×1200 162 PPI IPS |
| 6.87.6% | Asus ExpertBook Ultra B9406CAA Intel Core Ultra X7 358H ⎘ Intel Arc B390 12 Xe3 Panther Lake iGPU ⎘ 32 GB Memory, 2048 GB SSD | Amazon: | 1.1 kg | 15.9 mm | 14.00″ 2880×1800 243 PPI OLED |
Transparency
The selection of devices to be reviewed is made by our editorial team. The test sample was provided to the author as a loan by the manufacturer or retailer for the purpose of this review. The lender had no influence on this review, nor did the manufacturer receive a copy of this review before publication. There was no obligation to publish this review. As an independent media company, Notebookcheck is not subjected to the authority of manufacturers, retailers or publishers.
This is how Notebookcheck is testing
Every year, Notebookcheck independently reviews hundreds of laptops and smartphones using standardized procedures to ensure that all results are comparable. We have continuously developed our test methods for around 20 years and set industry standards in the process. In our test labs, high-quality measuring equipment is utilized by experienced technicians and editors. These tests involve a multi-stage validation process. Our complex rating system is based on hundreds of well-founded measurements and benchmarks, which maintains objectivity. Further information on our test methods can be found here.